Quick Summary: LLM serving benchmarks measure inference performance across throughput, latency, and cost efficiency metrics. Benchmarking tools like MLPerf, vLLM, and GuideLLM help organizations evaluate deployment options, with self-hosted small models (7-14B parameters) costing 95-99% less than commercial APIs while maintaining comparable performance for many use cases.
Large language model deployment costs can make or break an AI project. According to AWS and other industry reports, inference consumes more than 90% of total LLM power consumption in production environments. That’s a massive operational expense that demands careful measurement.
Benchmarking LLM serving performance isn’t just about speed anymore. Cost efficiency has become the primary concern for organizations scaling AI applications. The question isn’t whether a model can handle requests—it’s whether it can do so profitably.
Here’s the thing though: most teams lack a systematic approach to measuring both performance and cost simultaneously. They optimize for one metric and watch expenses spiral out of control.
Understanding LLM Serving Benchmarks
Performance benchmarks measure how LLMs behave under specific conditions. Unlike model quality leaderboards that rank reasoning ability, serving benchmarks focus on operational metrics: throughput, latency, resource utilization, and ultimately, cost per inference.
The MLCommons MLPerf Inference benchmark suite represents the industry standard for measuring ML and AI workload performance. The MLPerf Inference 5.1 release introduced Llama3.1-8B as a benchmark model, offering a 128,000 token context length that reflects real-world enterprise requirements.
But wait—what actually matters when benchmarking?
Key Performance Metrics
Throughput measures requests processed per second. Higher throughput means more users served with the same hardware. GuideLLM calculates comprehensive percentiles including 0.1th, 1st, 5th, 10th, 25th, 75th, 90th, 95th, and 99th percentiles for throughput and other metrics.
Latency measures response time. MLPerf defines specific latency constraints for different scenarios. Single stream scenarios measure 90th percentile latency, while server scenarios target sub-second response times for interactive applications.
Time to first token (TTFT) matters for user experience. Real talk: users notice when responses take more than 200-300ms to start appearing. This metric directly impacts perceived application responsiveness.
Token generation throughput differs from request throughput. It measures tokens produced per second, which directly correlates with user-visible output speed. Recent research on reasoning language model inference serving shows significant memory fluctuations during token generation that impact this metric.
Standard Benchmark Scenarios
MLPerf defines four primary scenarios. Each simulates different application patterns with specific load characteristics.
| Scenario | Query Generation | Latency Constraint | Performance Metric |
|---|---|---|---|
| Single Stream | Sequential queries | 90th percentile | 90%-ile latency |
| Multiple Stream | Fixed interval batches | 99th percentile | Maximum streams |
| Server | Poisson distribution | 99th percentile | Queries per second |
| Offline | All queries at once | None | Total throughput |
Server scenarios simulate production API loads with Poisson-distributed requests. This pattern reflects realistic user behavior where requests arrive randomly rather than at fixed intervals.
Measuring LLM Inference Costs
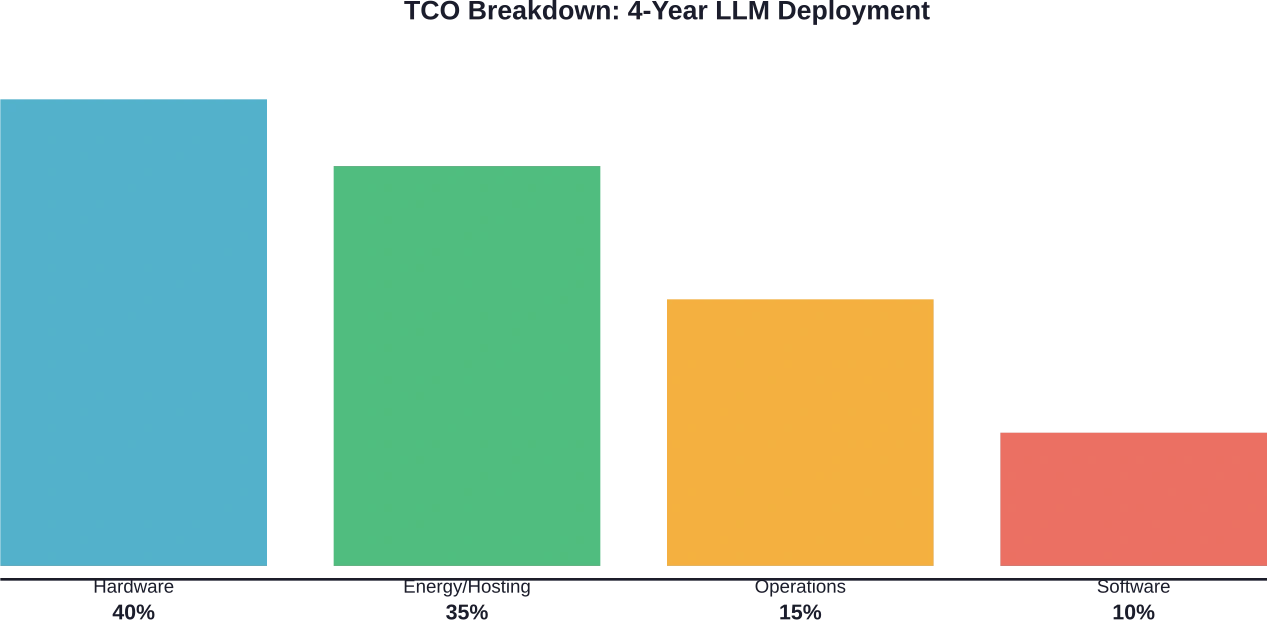
Cost analysis requires understanding both direct and indirect expenses. Hardware depreciation, energy consumption, hosting fees, and operational overhead all contribute to total cost of ownership.
According to the economics of inference framework from the WiNGPT Team, LLM inference should be treated as compute-driven intelligent production. The A800 80G GPU, for example, has a baseline hourly cost of approximately $0.79 per hour, typically ranging between $0.51 and $0.99 per hour under common operational assumptions.
Total Cost of Ownership Components
Hardware costs start with acquisition. Server configurations with 8 GPUs can cost $320,000 or more depending on the GPU model. Depreciation typically follows a four-year cycle for enterprise deployments.
Infrastructure provisioning costs include hosting fees, power consumption, cooling, and rack space. These operational expenses compound over time. For cloud deployments, instance pricing varies significantly based on GPU type and region.
Software licensing and maintenance add recurring costs. Open-source serving frameworks like vLLM eliminate licensing fees, but commercial solutions charge per deployment or per token processed.
Self-Hosted vs. API Cost Comparison
Cost ratios reveal dramatic differences between deployment approaches. Research published by Fin AI demonstrates that smaller models deliver substantial savings compared to commercial APIs.
| Model | Parameters | Cost vs GPT-4.1 | Cost vs GPT-4.1 Mini | Cost vs Sonnet 3.7 |
|---|---|---|---|---|
| Gemma 3 4B | 4B | 0.04 | 0.20 | 0.01 |
| DeepSeek Llama 8B | 8B | 0.05 | 0.27 | 0.01 |
| Qwen 3 14B | 14B | 0.05 | 0.27 | 0.01 |
| Gemma 3 27B | 27B | 0.34 | 1.71 | 0.08 |
| DeepSeek Llama 70B | 70B | 1.70 | 8.49 | 1.10 |
| Qwen 3 235B | 235B | 2.17 | 10.83 | 1.40 |
Smaller models under 14B parameters cost significantly less than GPT-4 class models, with research showing costs at 0.04-0.05x relative to GPT-4.1. That’s transformative for high-volume applications where quality requirements permit smaller model usage.
Salesforce Engineering documented saving more than $500K annually by replacing live LLM dependencies with a mock service for development and benchmarking workflows. This eliminated token consumption for non-production testing while maintaining validation capabilities at 16,000 requests per minute with burst capacity exceeding 24,000 requests per minute.
Benchmarking Tools and Frameworks
Multiple frameworks support systematic LLM serving benchmarks. Each offers different capabilities for measuring performance and cost efficiency.
vLLM Benchmarking Suite
The vLLM project provides built-in benchmarking tools for throughput and latency measurement. The framework supports various datasets including ShareGPT, BurstGPT, and synthetic random data generated from model tokenizers.
Key vLLM benchmark parameters include max concurrency limits, request rates, and dataset selection. Setting max concurrency to 10 means the server processes up to 10 requests simultaneously, queuing additional requests until capacity becomes available.
The vLLM-ascend v0.7.3 release benchmarks demonstrated performance with Qwen2.5-7B-Instruct and Qwen2.5-VL-7B-Instruct models at QPS rates of 1, 4, 16, and infinity (unlimited). Testing used 200 randomly sampled prompts from ShareGPT and vision-arena datasets with fixed random seeds for reproducibility.
GuideLLM for Production Benchmarking
GuideLLM from the vLLM project specializes in real-world inference evaluation. It simulates different traffic patterns through configurable load profiles.
Rate-based load testing supports constant request rates. Running at 10 requests per second for 20 seconds with synthetic data of 128 prompt tokens and 256 output tokens provides baseline throughput measurements. The tool calculates comprehensive percentile distributions including 0.1th, 1st, 5th, 10th, 25th, 50th, 75th, 90th, 95th, 99th, and 99.9th percentiles for every metric.
Load patterns matter because different applications generate different traffic shapes. Burst testing reveals system behavior under sudden load spikes, while sustained testing measures steady-state performance.
MLPerf Inference Benchmarks
MLPerf Inference represents the authoritative industry standard. The benchmark suite covers datacenter and mobile scenarios with standardized workloads across vision, speech, and language processing domains.
For datacenter scenarios, MLPerf measures queries per second under specific latency constraints. Server scenario benchmarks use Poisson-distributed query patterns with 99th percentile latency targets. Offline scenarios maximize throughput without latency constraints.
The MLPerf Inference 5.1 release introduced Llama3.1-8B with 128,000 token context support. This benchmark reflects modern enterprise requirements for long-context understanding and generation tasks.
GPU Cost and Performance Trade-offs
Hardware selection dramatically impacts both performance and cost efficiency. Research on cost-efficiency in LLM serving over heterogeneous GPUs reveals that different GPU types align with different workload characteristics.
| GPU Type | Peak FP16 FLOPS | Memory Bandwidth | Memory Limit | Price per Hour |
|---|---|---|---|---|
| A6000 | 91 TFLOPS | 768 GB/s | 48 GB | $0.83 |
| A40 | 150 TFLOPS | 696 GB/s | 48 GB | $0.55 |
| L40 | 181 TFLOPS | 864 GB/s | 48 GB | $1.15 |
Memory bandwidth often matters more than compute capacity for LLM inference. Token generation is memory-bound, repeatedly loading model weights from GPU memory. The A6000 has a memory bandwidth of 768 GB/s, which is lower than the L40 (864 GB/s) and significantly lower than the H100 or A100 (2-3 TB/s).
Heterogeneous GPU deployments optimize cost-efficiency by matching GPU capabilities to request characteristics. Compute-intensive requests route to high-FLOPS GPUs, while memory-intensive requests prefer high-bandwidth options. This approach improves resource utilization across diverse request patterns.
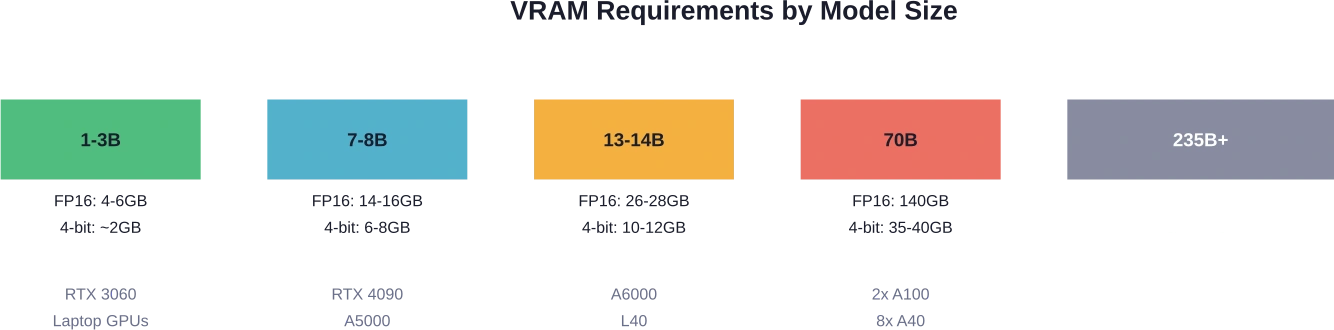
Model Size and Hardware Requirements
Parameter count directly determines minimum memory requirements. FP16 precision requires approximately 2 bytes per parameter, while 4-bit quantization reduces this to roughly 0.5 bytes per parameter.
Cloud GPU options vary significantly in capability and cost. AWS g4dn.xlarge instances support basic workloads with consumer-grade GPUs. AWS g5.xlarge provides better performance for 7-8B models. Larger models require multi-GPU configurations or specialized high-memory instances.
Optimizing Cost-Efficiency
Cost optimization requires balancing multiple factors simultaneously. Performance, quality, and expense trade-offs demand systematic measurement and iteration.
Quantization Impact
4-bit quantization reduces memory requirements and increases throughput with minimal quality degradation. Most applications tolerate quantization without noticeable performance loss. 4-bit quantization reduces memory requirements by approximately 75% compared to FP16 precision while maintaining throughput improvements.
8-bit quantization offers a middle ground, providing better quality preservation with moderate memory savings. For quality-sensitive applications, 8-bit represents a safer choice than aggressive 4-bit quantization.
Batch Size Tuning
Larger batch sizes improve GPU utilization and throughput. Processing 32 requests simultaneously achieves better hardware efficiency than processing them sequentially. However, larger batches increase latency for individual requests.
Dynamic batching optimizes this trade-off by grouping requests that arrive within a time window. When requests arrive sporadically, smaller effective batch sizes maintain low latency. During peak load, automatic batching maximizes throughput.
Request Routing Strategies
Intelligent request routing to heterogeneous GPU types improves cost-efficiency. Short requests with small batch sizes route to compute-optimized GPUs. Long-context requests require substantial memory access to bandwidth-optimized hardware.
Load balancing across replicas prevents hotspots and improves overall utilization. Round-robin routing works for homogeneous workloads, but request-aware routing delivers better results for diverse request patterns.
Building a TCO Calculator
Accurate cost estimation requires systematic accounting of all expense components. Organizations need visibility into actual costs per request to make informed deployment decisions.
Hardware costs divide into acquisition and depreciation. An 8-GPU server at $320,000 with a 4-year depreciation period costs $80,000 annually or approximately $9.13 per hour assuming 24/7 operation.
Operating expenses include hosting fees, power consumption, and maintenance. Cloud deployments simplify this calculation—hourly instance costs include most operational expenses. Self-hosted deployments require separate tracking of facility costs, power at typical rates of $0.10-0.15 per kWh, and administrative overhead.
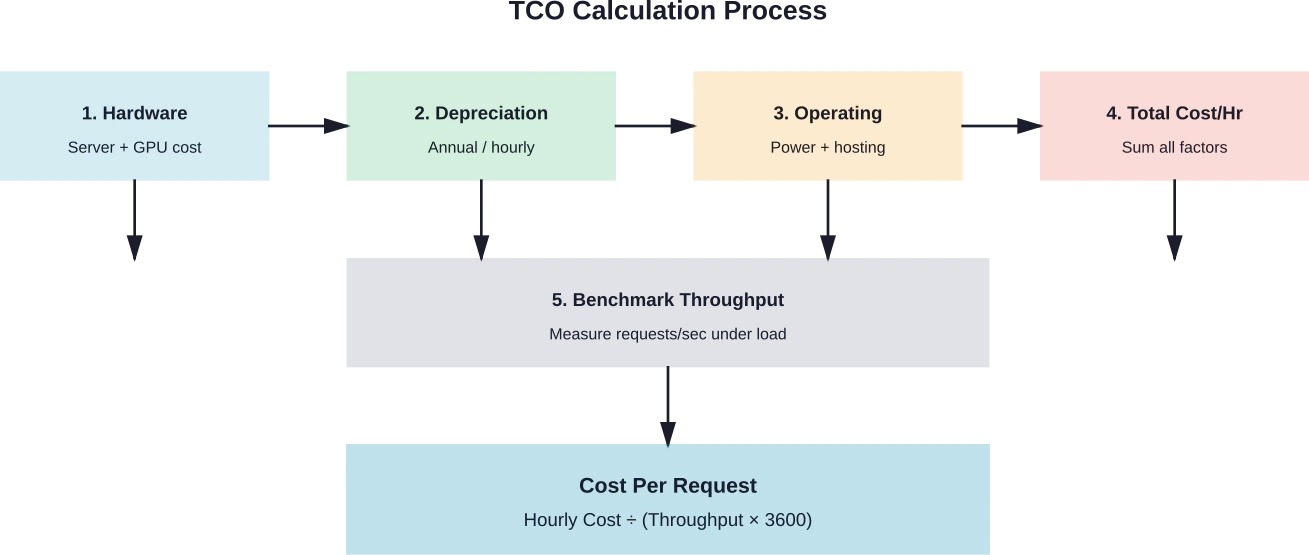
The formula for cost per request combines hourly costs with measured throughput:
Cost per request = Hourly cost ÷ (Requests per second × 3,600)
For a deployment costing $10 per hour that serves 50 requests per second, cost per request equals $0.0000556 or approximately $0.056 per 1,000 requests.

Cut LLM Serving Costs With Smarter Model Engineering
Serving benchmarks often focus on tokens, GPUs, and infrastructure pricing. But real cost differences usually come from how the model is designed and deployed. AI Superior works on the engineering layer – building custom LLMs, optimizing training pipelines, and structuring deployments so models run efficiently in production.
If your benchmarks show high serving costs, the issue may be the architecture or inference setup. Talk to AI Superior to review your LLM system and identify practical ways to reduce serving costs.
Practical Benchmarking Workflow
Systematic benchmarking follows a repeatable process. Starting with representative workloads ensures measurements reflect production conditions.
Dataset Selection
ShareGPT provides realistic conversation patterns with varied prompt lengths and response requirements. The dataset contains actual user interactions, making it valuable for production-like testing. Randomly sampling 200-500 prompts with a fixed random seed ensures reproducible results.
Synthetic datasets allow controlled testing of specific scenarios. Random token generation creates prompts with predetermined length distributions. This approach tests edge cases like maximum context length or unusual token patterns.
Load Pattern Configuration
Constant rate testing measures steady-state performance. Running at 10 QPS for 60 seconds establishes baseline throughput and latency characteristics. Incrementally increasing rates identifies the maximum sustainable load before latency degradation.
Burst testing reveals behavior under sudden traffic spikes. Ramping from 1 QPS to 100 QPS over 10 seconds and measuring recovery time shows system resilience. Production systems frequently experience burst patterns during peak usage hours.
Analyzing Results
Percentile distributions reveal outlier behavior that averages obscure. While 50th percentile latency might be acceptable, 99th percentile values show worst-case user experience. GuideLLM automatically calculates percentiles from 0.1% through 99.9% for comprehensive analysis.
Throughput degradation under sustained load indicates resource contention. Stable throughput across test duration demonstrates proper scaling. Declining throughput suggests memory leaks, thermal throttling, or other systemic issues.
Energy and Power Considerations
Power consumption directly impacts operational costs and environmental sustainability. TokenPowerBench research emphasizes that inference power consumption exceeds training costs by a factor of 10x or more for production systems serving billions of queries daily.
ML.ENERGY Benchmark data shows that energy has become a critical bottleneck resource. Getting access to sufficient power infrastructure for GPU fleets costs more and takes longer than hardware procurement in many regions.
Power measurement during benchmarking provides cost visibility. Typical GPU power consumption ranges from 250W for efficiency-optimized cards to 700W for high-performance accelerators. At $0.12 per kWh, a 400W GPU costs approximately $0.048 per hour just for electricity.
Multiplying power costs by GPU count and adding facility overhead yields total energy expenses. For an 8-GPU server drawing 3,200W plus overhead, energy costs approach $0.40-0.50 per hour depending on local electricity rates and cooling efficiency.
Frequently Asked Questions
What is the most cost-effective model size for production deployment?
Models between 7B and 14B parameters offer strong cost-efficiency for enterprise applications. Research from Fin AI shows these models cost approximately 0.05x relative to GPT-4 class models while maintaining acceptable quality for tasks like customer support, content classification, and structured data extraction. Smaller 1-3B models work for simple classification tasks, while 70B+ models should be reserved for applications requiring maximum reasoning capability.
How does batch size affect LLM serving costs?
Larger batch sizes improve GPU utilization and reduce cost per request by processing multiple queries simultaneously. Doubling batch size from 8 to 16 typically increases throughput by 40-60% without proportional hardware cost increases. However, batch size increases latency for individual requests. Dynamic batching strategies balance these trade-offs by adjusting batch size based on current load, maximizing throughput during peak demand while maintaining low latency during off-peak periods.
Should organizations self-host LLMs or use commercial APIs?
Self-hosting smaller models can be cost-effective for high-volume deployments, with break-even points varying based on model size and hardware configuration. Below this threshold, commercial API pricing remains competitive when accounting for operational overhead. Self-hosted deployments can deliver substantial cost savings compared to commercial APIs depending on model size and deployment configuration. Organizations should also consider technical expertise requirements, as self-hosting demands infrastructure management, monitoring, and performance optimization capabilities that commercial APIs handle automatically.
What benchmarking tools work best for measuring LLM serving performance?
GuideLLM excels for real-world production benchmarking with configurable load patterns and comprehensive metrics. The vLLM benchmarking suite provides excellent integration for teams already using vLLM for serving. MLPerf Inference offers authoritative standardized benchmarks for comparing across different hardware and software configurations. Multiple benchmarking tools serve different purposes: MLPerf for standardized comparisons, GuideLLM for real-world production patterns, and vLLM tools for framework-integrated testing.
How much VRAM is required for different model sizes?
FP16 precision requires approximately 2 bytes per parameter: 7B models need 14-16GB, 13B models need 26-28GB, and 70B models need 140GB. 4-bit quantization reduces requirements by 75%: 7B models run in 6-8GB, 13B models in 10-12GB, and 70B models in 35-40GB. Add 20-30% overhead for KV cache and activation memory. A 7B model in 4-bit quantization comfortably runs on consumer GPUs with 8GB VRAM, while 70B models require professional GPUs with 40GB+ or multi-GPU configurations.
What causes latency variability in LLM inference?
Memory bandwidth limitations create the primary latency bottleneck. Token generation repeatedly loads model weights from GPU memory, making inference memory-bound rather than compute-bound. Request queuing during high load adds variable waiting time. KV cache size grows with context length, increasing memory pressure and slowing subsequent tokens. Research on reasoning language model inference shows significant memory fluctuations that impact consistent performance. Monitoring 99th percentile latency reveals these variations better than average metrics.
How do heterogeneous GPU deployments improve cost-efficiency?
Different GPU types excel at different workload characteristics. High-bandwidth GPUs like the A6000 (768 GB/s) optimize memory-bound token generation, while high-compute GPUs like the A40 (150 TFLOPS) excel at compute-intensive operations. Research published at ICML 2025 demonstrates that routing requests based on compute and memory requirements improves utilization across heterogeneous fleets. Heterogeneous GPU deployments can substantially optimize cost-efficiency compared to homogeneous approaches by matching request characteristics to appropriate GPU types. rather than over-provisioning single GPU types.
Conclusion
LLM serving benchmarks provide essential visibility into performance and cost trade-offs that determine deployment viability. Organizations that systematically measure throughput, latency, and total cost of ownership make informed decisions about self-hosting versus commercial APIs, model size selection, and hardware provisioning.
The data shows clear patterns. Smaller models between 7B and 14B parameters deliver 95-99% cost savings compared to frontier commercial models while maintaining acceptable quality for many enterprise applications. Self-hosting cost-effectiveness depends on daily token volume, hardware costs, and operational overhead specific to each organization. 4-bit quantization reduces memory requirements by 75% with minimal quality impact.
But here’s what matters most: benchmarking isn’t a one-time activity. Performance characteristics change with model updates, serving framework improvements, and evolving workload patterns. Organizations that establish continuous benchmarking workflows maintain cost-efficiency as their AI deployments scale.
Start with representative workloads from production traffic. Measure comprehensively across throughput, latency percentiles, and resource utilization. Calculate true TCO including hardware depreciation, energy consumption, and operational overhead. Test multiple deployment configurations to identify optimal cost-performance balance for specific use cases.
The tools exist—MLPerf, vLLM, GuideLLM, and others provide robust benchmarking capabilities. The methodologies are proven through industry adoption and academic research. What remains is systematic application of these frameworks to each organization’s unique requirements and constraints. Benchmark diligently, optimize continuously, and watch LLM serving costs become sustainable at scale.