Quick Summary: Business intelligence transforms finance operations by converting raw data into actionable insights for strategic decision-making. Financial teams use BI tools to automate reporting, forecast performance, manage risks, and optimize profitability. Modern BI platforms integrate data from multiple sources, enabling real-time analytics that support everything from budget planning to fraud detection.
Financial data sits everywhere. Scattered across accounting systems, transaction databases, spreadsheets, and legacy platforms. Finance teams spend countless hours manually pulling reports, reconciling numbers, and trying to spot patterns that matter.
Business intelligence changes that equation entirely.
BI tools consolidate financial data from disparate sources into unified dashboards that update in real time. Instead of waiting days for month-end reports, finance teams get instant visibility into cash flow, profitability, and performance metrics. And here’s what makes the difference: BI doesn’t just show what happened—it reveals why it happened and what’s likely to happen next.
The economic context matters here. According to the Federal Reserve, 73% of adults reported doing okay or living comfortably financially in 2025, consistent with 2024 but below the 2021 peak of 78%. Meanwhile, 53% of adults cited price increases as a major concern in 2025, down slightly from 56% in 2024. These pressures make efficient financial management critical for both businesses and individuals.
Finance departments are evolving from backward-looking scorekeepers into forward-looking strategic partners. BI makes that transformation possible.
What Business Intelligence Means for Finance
Business intelligence refers to the technologies, processes, and practices that convert raw data into meaningful information. For finance teams, BI encompasses data warehousing, analytics platforms, reporting tools, and visualization software that work together to support decision-making.
The core components include:
- Data integration: Pulling information from accounting systems, ERPs, CRMs, and external sources into a centralized repository
- Data processing: Cleaning, transforming, and organizing financial data for analysis
- Analytics engines: Running calculations, statistical models, and machine learning algorithms to identify patterns
- Reporting and visualization: Presenting insights through dashboards, charts, and interactive reports
What separates finance BI from generic analytics? The focus on financial metrics, compliance requirements, and the precision demanded by accounting standards. A marketing dashboard might tolerate approximate figures. A financial report cannot.
How BI Works in Financial Environments
Financial business intelligence operates through a continuous cycle. Data flows automatically from source systems—general ledgers, payroll platforms, billing software—into the BI platform. The system validates data quality, flags anomalies, and organizes information according to predefined rules.
Finance teams then build reports and dashboards tailored to specific needs. A CFO might monitor high-level KPIs like EBITDA and cash runway. Controllers focus on account reconciliations and variance analysis. FP&A teams dig into revenue forecasts and scenario modeling.
The platform updates automatically. When a new transaction posts to the accounting system, it flows through to relevant reports within minutes or hours rather than weeks.

Build BI Tools With AI Superior
AI Superior develops custom AI software, including BI solutions, predictive analytics, big data analytics, and machine learning systems. Their team can help turn finance data into reporting tools, forecasting models, dashboards, and decision-support software.
For finance teams, this can support cash flow analysis, budget planning, risk signals, performance tracking, and clearer use of data from existing systems.
Need BI Built Around Your Finance Data?
AI Superior can help with:
- building custom BI and analytics tools
- developing predictive finance models
- connecting scattered data sources
- integrating AI tools into existing systems
👉 Contact AI Superior to discuss your project.
Core Finance Applications of Business Intelligence
Finance teams deploy BI across multiple domains. Each application addresses specific pain points and delivers measurable value.
Financial Performance Monitoring and Forecasting
Real-time performance dashboards replace static monthly reports. Finance teams track revenue, expenses, margins, and cash positions as they evolve. Variance analysis happens automatically—the system flags when actuals deviate from budget and highlights which accounts drove the difference.
Forecasting becomes more sophisticated. Rather than relying on simple trend lines, BI platforms apply statistical models that account for seasonality, market conditions, and historical patterns. Federal Reserve data shows inflation remained above the 2% target, with the personal consumption expenditures price index at 2.8% for the 12 months ending February 2026. Finance teams need forecasting tools that can model these macroeconomic variables alongside company-specific factors.
Strategic Planning and Budgeting
Annual budgeting cycles compress from months to weeks. BI platforms let finance teams model multiple scenarios simultaneously—what happens if revenue grows 10% versus 15%? How does a 5% cost reduction in operations impact overall profitability?
The tools support rolling forecasts that update quarterly or monthly rather than remaining locked to annual cycles. When market conditions shift rapidly, static annual budgets become obsolete. Rolling forecasts keep planning relevant.
Profitability Analysis
Which products, customers, or business units actually make money? BI platforms slice financial data across multiple dimensions to answer that question. Activity-based costing models allocate overhead expenses accurately, revealing true profitability at granular levels.
Finance teams can identify profitable customer segments, underperforming product lines, and operational inefficiencies that drain margins. That intelligence drives strategic decisions about where to invest and where to cut.
Cash Flow Management
Cash remains king. BI tools track cash conversion cycles, monitor accounts receivable aging, and predict future cash positions. Finance teams spot potential shortfalls weeks in advance rather than discovering them in crisis mode.
The Federal Reserve reports that adults’ ability to cover a $400 emergency expense with cash or equivalent remained unchanged from 2024. Businesses face similar liquidity pressures. BI helps maintain adequate cash reserves while optimizing working capital.
Risk Management and Compliance
Financial risk takes many forms—credit risk, market risk, operational risk, compliance violations. BI platforms monitor risk indicators continuously, flagging anomalies that might signal fraud, errors, or regulatory issues.
Compliance reporting becomes automated. Rather than manually compiling data for audits or regulatory filings, BI systems generate required reports with audit trails showing exactly where each number originated.
Key Capabilities Finance Teams Need
Not all BI platforms suit financial applications equally well. Finance teams should evaluate tools based on capabilities that matter for their specific requirements.
| Capability | Why It Matters | What to Look For |
|---|---|---|
| Data integration | Finance data lives across multiple systems | Pre-built connectors for major ERPs, accounting platforms, and databases |
| Data accuracy | Financial reporting demands precision | Validation rules, audit trails, reconciliation tools |
| Security and access control | Financial data is sensitive | Role-based permissions, encryption, compliance certifications |
| Financial modeling | Complex calculations and allocations | Support for custom formulas, what-if scenarios, driver-based models |
| Real-time reporting | Timely insights drive better decisions | Live data connections, automatic refresh, alerts |
| Scalability | Data volumes grow over time | Cloud architecture, performance at scale |
Finance-specific features separate general-purpose BI tools from platforms built for financial teams. Look for built-in financial templates, period-over-period comparisons, variance analysis, and support for hierarchical account structures.
Integration with Financial Systems
The BI platform must connect seamlessly to existing financial infrastructure. That means native integrations with popular ERPs—SAP, Oracle, NetSuite, Microsoft Dynamics—plus accounting platforms like QuickBooks or Xero for smaller organizations.
But here’s what matters more than pre-built connectors: how the platform handles data extraction, transformation, and loading. Can it pull data on schedules that match financial close cycles? Does it preserve data lineage so auditors can trace figures back to source transactions?
Benefits Business Intelligence Delivers to Finance
Finance teams adopt BI for concrete operational improvements, not theoretical advantages. The benefits show up in daily work and bottom-line results.
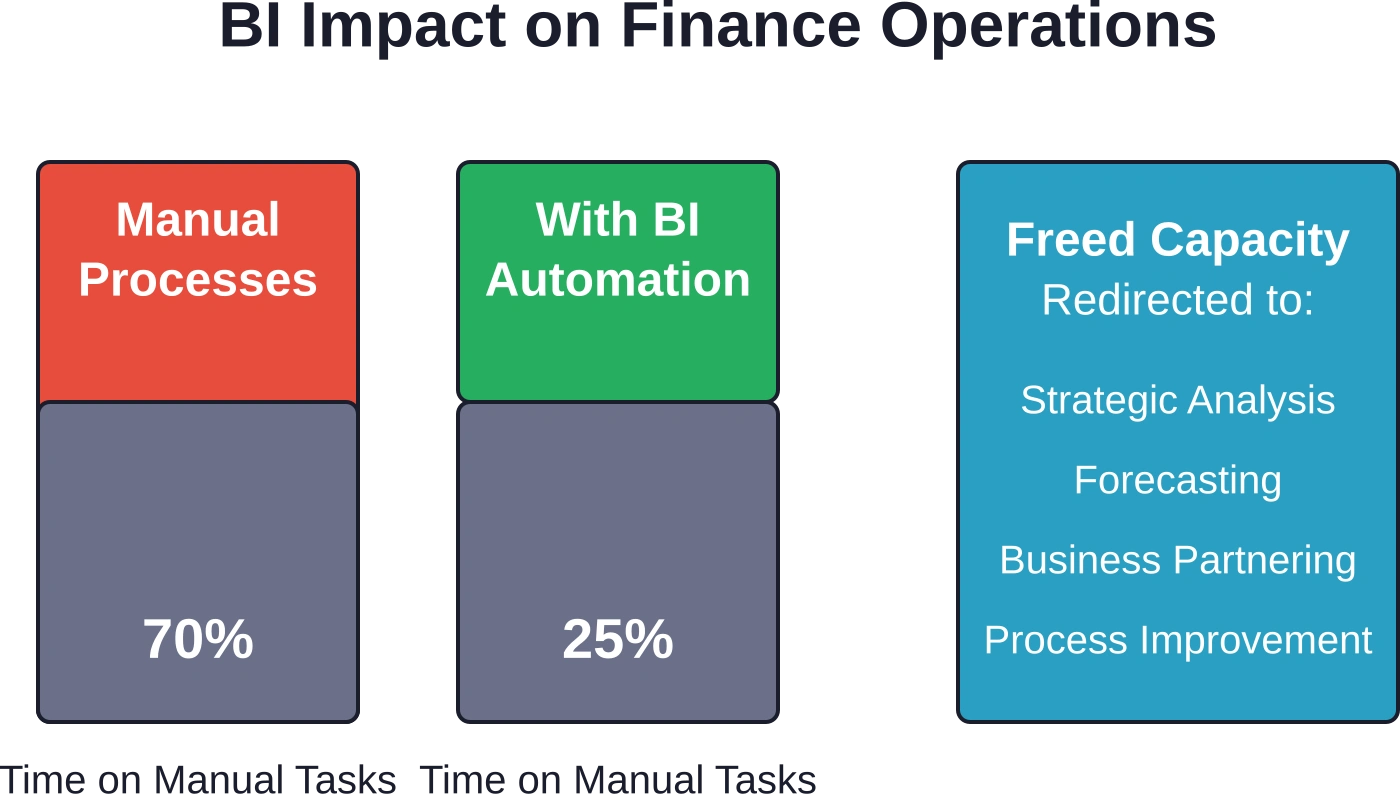
Automation Eliminates Manual Work
Finance professionals spend significant time on repetitive tasks—copying data between systems, building Excel reports, reconciling accounts. BI automates those processes. Reports generate automatically. Data flows between systems without manual intervention. Reconciliations happen through automated matching rules.
That freed capacity gets redirected to higher-value analysis and strategic work.
Faster Decision-Making
When finance teams wait days or weeks for reports, decisions get delayed. By the time the data arrives, market conditions have shifted. BI platforms deliver insights in real time, enabling rapid response to opportunities and threats.
Real talk: speed only helps if the data is right. Fast access to wrong information accelerates bad decisions. That’s why data quality controls matter as much as performance.
Improved Accuracy and Reduced Errors
Manual data handling introduces errors—typos, formula mistakes, version control issues. Automated data pipelines eliminate those risks. The system applies consistent business rules and calculations every time.
Finance teams gain confidence in their numbers. Audit trails show exactly how figures were calculated and where source data originated.
Enhanced Strategic Insight
Moving beyond what happened to why it happened—that’s where BI delivers strategic value. Drill-down capabilities let finance teams investigate anomalies, compare performance across segments, and identify drivers of financial outcomes.
Predictive analytics extend that insight forward. Rather than reacting to results after the fact, finance teams anticipate trends and model future scenarios.
Common Challenges and How to Overcome Them
BI implementations don’t always go smoothly. Finance teams encounter predictable obstacles. Knowing what to expect helps.
Data Quality and Integration Issues
Garbage in, garbage out. If source data contains errors, duplicates, or inconsistencies, BI tools amplify those problems. Finance teams must establish data governance practices—validation rules, master data management, regular audits—before expecting reliable analytics.
Integration complexity grows with system sprawl. Organizations running multiple ERPs, regional accounting platforms, and legacy databases face significant technical challenges connecting everything. Phased rollouts work better than big-bang implementations.
User Adoption and Change Management
Building dashboards is the easy part. Getting finance teams to actually use them? That’s harder. People resist changing established workflows, especially when those workflows involve familiar Excel spreadsheets.
Successful implementations focus on user training, demonstrate clear value, and involve end users early in design. When finance professionals help build the reports they’ll use, adoption improves dramatically.
Cost and Resource Constraints
Enterprise BI platforms carry substantial price tags. Implementation requires dedicated resources—IT support, data engineers, business analysts. Smaller finance teams may struggle to justify the investment.
Cloud-based BI tools offer lower entry points with subscription pricing rather than major capital outlays. Starting with specific high-value use cases—automating the most painful manual reports—builds momentum and demonstrates ROI before expanding.
Security and Compliance Requirements
Financial data faces strict regulatory requirements. BI platforms must support role-based access controls, audit logging, data encryption, and compliance with standards like SOX, GDPR, or industry-specific regulations.
Evaluate tools based on security certifications, compliance features, and data governance capabilities. Don’t assume general-purpose BI platforms understand financial compliance requirements.
Emerging Trends Shaping Finance BI
The technology keeps evolving. Several trends are reshaping how finance teams use business intelligence.
Artificial Intelligence and Machine Learning
AI enhances BI in multiple ways. Machine learning models detect anomalies in financial transactions, identifying potential fraud or errors faster than rule-based systems. Natural language processing lets finance teams query data conversationally rather than building reports manually.
Predictive models improve forecasting accuracy by identifying complex patterns humans might miss. But AI isn’t magic—models need clean training data and ongoing validation to ensure they’re actually helping rather than introducing new problems.
Real-Time and Continuous Analytics
Traditional BI operates on batch processes—data updates overnight, reports refresh daily or weekly. Modern platforms support continuous analytics with near-instant data propagation from source systems.
That capability matters especially for treasury operations, where real-time cash visibility enables better decisions about payments, investments, and liquidity management.
Cloud-Native Architecture
Finance BI is migrating from on-premise installations to cloud platforms. Cloud deployment offers faster implementation, automatic scaling, and lower infrastructure costs. It also enables remote access—increasingly important as finance teams work in distributed environments.
Federal Reserve research projects data center investment will reach a mean forecast of $370 billion annualized by 2026:Q2, with estimates indicating continued growth. That infrastructure expansion supports cloud-based analytics capabilities.
Self-Service Analytics
Finance professionals want to explore data and build reports without waiting for IT support. Self-service BI tools provide intuitive interfaces where users can create visualizations, run ad-hoc queries, and perform analysis independently.
The challenge? Balancing flexibility with governance. Finance teams need freedom to explore, but also guardrails that ensure data accuracy and prevent proliferation of inconsistent reports.
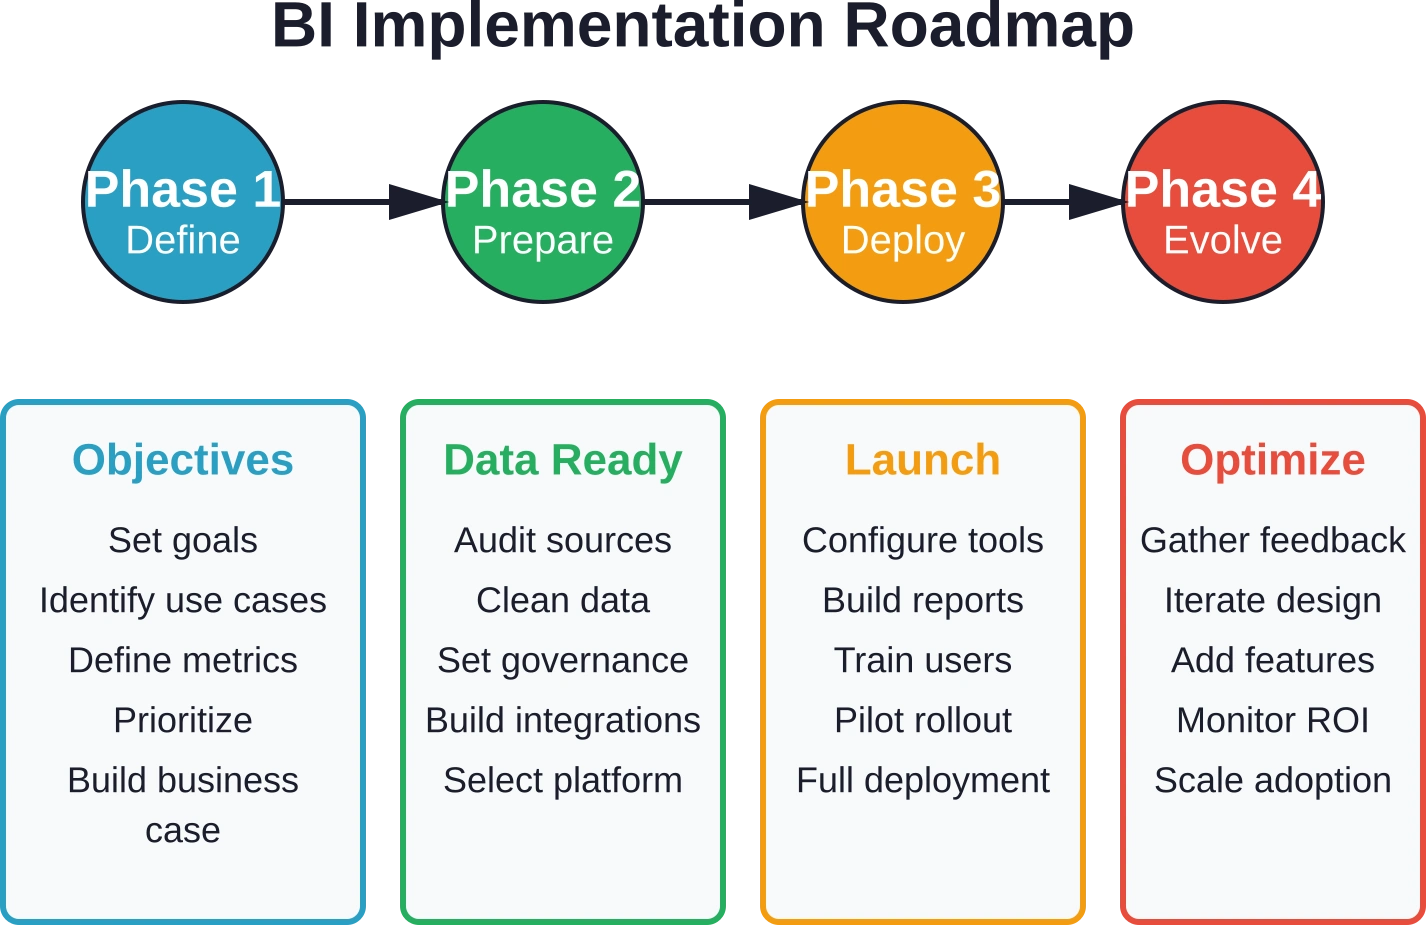
Implementing Business Intelligence Successfully
Technology alone doesn’t guarantee success. Finance teams need structured implementation approaches.
Start with Clear Business Objectives
What specific problems should BI solve? Faster month-end close? Better cash flow visibility? More accurate forecasts? Define measurable goals before selecting tools or building reports.
Prioritize use cases based on business impact and implementation complexity. Quick wins build credibility and momentum for more ambitious initiatives.
Assess and Prepare Data Infrastructure
Audit source systems to understand data quality, availability, and integration requirements. Document business rules for calculations, allocations, and transformations. Establish data governance policies and assign ownership.
This foundational work isn’t glamorous, but it determines whether the BI implementation succeeds or struggles.
Choose the Right Platform
Evaluate tools based on finance-specific requirements, not generic BI capabilities. Consider total cost of ownership including licensing, implementation, training, and ongoing maintenance. Check the official documentation for current feature availability rather than relying on outdated information.
Request demos focused on actual finance use cases from your organization, not generic presentations.
Design for Users, Not Technologists
Finance professionals need intuitive dashboards that answer business questions clearly. Avoid the temptation to showcase technical sophistication at the expense of usability.
Involve end users throughout design and testing. Iterate based on feedback. The best-designed report is the one finance teams actually use.
Plan for Ongoing Evolution
BI isn’t a one-time project. Business requirements change, new data sources emerge, and users request additional capabilities. Build processes for ongoing maintenance, enhancement, and support.
Establish a BI center of excellence or assign dedicated resources to ensure the platform evolves with the organization’s needs.
Measuring BI Success in Finance
How do finance teams know if BI is working? Success requires measurable outcomes tied to business objectives.
Operational Metrics
Track improvements in process efficiency. How much time does month-end close take now versus before BI implementation? How many hours per week do finance teams spend on manual reporting? Those metrics should trend downward.
Monitor data accuracy. Are reconciliations cleaner? Do audits uncover fewer errors? Quality improvements indicate the BI platform is delivering reliable information.
Business Impact Metrics
Connect BI to financial outcomes. Better cash flow forecasting should reduce borrowing costs or improve investment returns. More accurate profitability analysis should guide better resource allocation decisions. Quantify those impacts.
User adoption rates matter too. If finance teams keep reverting to Excel instead of using BI dashboards, the implementation hasn’t succeeded regardless of technical capabilities.
Strategic Value Indicators
Does finance participate more effectively in strategic planning? Are forecasts becoming more accurate? Is the organization making faster, better-informed decisions? Those qualitative improvements may be harder to measure but represent BI’s ultimate value.
The Future of Finance Business Intelligence
Where is this headed? Several forces are reshaping finance BI over the next few years.
Embedded analytics will bring BI capabilities directly into financial workflows rather than requiring separate reporting tools. Finance teams will access insights within the systems they already use daily.
Augmented analytics—AI that automatically surfaces insights and suggests analyses—will reduce the technical skills required for data exploration. Finance professionals will spend less time building reports and more time interpreting results.
Continuous planning will replace periodic budgeting cycles. BI platforms will support always-on forecasting that updates constantly as new information arrives.
And collaboration features will break down silos between finance, operations, and business units. Shared dashboards and coordinated planning processes will align decisions across the organization.
The economic environment demands better financial management. With price increases remaining a persistent concern for many adults, organizations face cost pressures. BI helps finance teams navigate volatility with data-driven precision.
Frequently Asked Questions
What’s the difference between business intelligence and financial analytics?
Financial analytics refers specifically to analyzing financial data and metrics. Business intelligence is the broader set of technologies and processes that enable analytics across all business domains, including finance. BI platforms provide the infrastructure—data integration, storage, reporting tools—while financial analytics represents one application of those capabilities focused on financial data.
How long does it take to implement BI for a finance department?
Implementation timelines vary widely based on organizational size, system complexity, and scope. A focused project addressing specific use cases might deploy in 2-3 months. Enterprise-wide implementations typically take 6-12 months or longer. Phased approaches that start with high-value use cases and expand incrementally tend to deliver results faster than comprehensive big-bang rollouts.
Can small businesses benefit from finance BI tools?
Absolutely. Cloud-based BI platforms offer subscription pricing and simplified deployment that makes them accessible to smaller organizations. Even basic BI capabilities—automated reporting, data visualization, simple forecasting—deliver value for small finance teams. The key is choosing tools scaled to organizational needs rather than enterprise platforms with features small businesses won’t use.
What technical skills do finance teams need to use BI effectively?
Modern BI platforms emphasize usability over technical complexity. Finance professionals need basic analytical skills and familiarity with financial concepts—they already have that. Self-service BI tools provide intuitive interfaces for building reports and dashboards without coding. That said, organizations benefit from having at least one person with deeper technical understanding to handle platform administration, integration configuration, and complex data modeling.
How do BI platforms ensure financial data security?
Enterprise BI tools provide multiple security layers. Role-based access controls restrict which users can see specific data based on their responsibilities. Encryption protects data both in transit and at rest. Audit logs track who accessed what information and when. Many platforms offer certifications for compliance standards like SOC 2, ISO 27001, and industry-specific regulations. Evaluate security capabilities carefully and ensure the platform meets regulatory requirements for financial data in relevant jurisdictions.
What happens to BI systems during mergers or organizational changes?
Organizational changes create BI challenges. Mergers introduce new data sources, different chart of accounts structures, and potentially incompatible systems. Successful navigation requires flexible BI architecture that can accommodate new integrations, data governance processes to resolve inconsistencies, and clear ownership to manage the transition. Cloud-based platforms typically adapt more easily than rigid on-premise installations. Plan for BI system evaluation and potential consolidation as part of broader integration planning.
Can BI replace financial analysts?
No. BI automates data collection, processing, and basic reporting—tasks that consume significant analyst time. But it doesn’t replace the judgment, business context, and strategic thinking financial analysts provide. In practice, BI makes analysts more effective by eliminating manual work and providing better tools for exploration and insight generation. The role shifts from data gathering to interpretation, from creating reports to explaining what the numbers mean and recommending actions.
Taking Action on Business Intelligence
Finance teams standing on the sidelines miss opportunities. Competitors using BI make faster decisions, spot trends earlier, and allocate resources more effectively.
But rushed implementations waste money and frustrate users. Start with clear objectives. What specific problems need solving? Which processes create the most pain? Where would better visibility deliver immediate value?
Assess current state honestly. How clean is financial data? Which systems need to integrate? What governance gaps exist? Address foundational issues before layering technology on top.
Evaluate platforms based on finance-specific requirements. Generic BI tools may lack capabilities financial teams need. Request demos focused on actual use cases. Check official websites for current pricing rather than relying on outdated information. Validate that security and compliance features meet regulatory requirements.
Involve end users throughout implementation. Finance professionals who help design reports they’ll use adopt them more readily. Training matters as much as technology.
And remember: BI isn’t a destination. The platform needs ongoing attention, evolution, and optimization. Plan for that reality from the start.
The economic data from the Federal Reserve indicates steady economic conditions. Inflation ran at 2.8% for the 12 months ending February 2026—above the Federal Reserve’s 2% target. Finance teams need tools that help navigate this environment with precision and agility.
Business intelligence provides those tools. The question isn’t whether to adopt BI—it’s how quickly finance teams can implement it effectively and start capturing value.