Quick Summary: Predictive analytics in Power BI combines historical data analysis with machine learning to forecast future trends and outcomes. Power BI offers native forecasting capabilities, Python and R integration, and Azure Machine Learning integration for building predictive models. Organizations can leverage these tools to anticipate customer behavior, optimize operations, and make data-driven decisions without extensive coding knowledge. Power BI has evolved beyond creating beautiful dashboards. It’s now a platform where historical data transforms into actionable predictions about what’s coming next. Forecasting sales, identifying at-risk customers, predicting equipment failures—these aren’t science fiction scenarios. They’re practical applications organizations implement today using Power BI’s predictive capabilities. The platform offers multiple paths to predictive analytics. Native forecasting tools work straight out of the box. Python and R scripts unlock advanced machine learning models. Azure Machine Learning integration bridges the gap between data scientists and business analysts.
What Makes Predictive Analytics Different from Standard Reporting
Traditional Power BI reports answer what happened. Predictive analytics answers what will happen. Standard dashboards show last quarter’s sales figures, current inventory levels, or yesterday’s web traffic. That’s descriptive analytics—essential but backward-looking. Predictive analytics flips the script. Historical patterns become training data. Statistical algorithms identify relationships between variables. Models generate probability-based forecasts. Here’s the thing though—predictive analytics doesn’t guarantee the future. It calculates likelihoods based on past behavior. When customer purchase patterns suggest a 78% probability of churn, that informs retention strategies. When seasonal trends indicate a February sales spike, inventory teams prepare accordingly. According to Ohio University’s research published October 1, 2024, predictive analytics helps businesses determine potential outcomes and avoid unnecessary losses. According to Ohio University, demand for data scientists is expected to grow 36% between 2023 and 2033, resulting in more than 73,000 new jobs. Organizations with strong analytics capabilities translate data mountains into strategic advantages. 
Use Predictive Analytics in Power BI with AI Superior
AI Superior helps connect predictive models with reporting tools like Power BI, so insights can be used directly in dashboards and decision-making. The focus is on building models separately and then integrating outputs into BI systems for practical use.
Looking to Add Predictive Analytics to Power BI?
AI Superior can help with:
- building predictive models
- connecting models to BI tools
- integrating outputs into dashboards
- refining models based on feedback
👉 Contact AI Superior to discuss your project, data, and implementation approach
Native Forecasting Capabilities in Power BI
Power BI Desktop includes built-in forecasting that requires zero coding. It’s designed for business analysts who need quick predictions without PhD-level statistics knowledge.
The Analytics Pane Forecasting Feature
Line charts in Power BI hide a simple forecasting tool. Click any line chart, open the Analytics pane, and expand the Forecast option. The feature uses exponential smoothing algorithms. These automatically detect seasonality in time-series data—daily patterns, weekly cycles, monthly trends. The algorithm adjusts weights based on how recent data points are, giving more influence to newer observations. According to Microsoft’s official blog from May 8, 2014, forecasting capabilities were introduced in Power View for Office 365, using exponential smoothing to automatically detect seasonality in the data. Configuration options include forecast length (how many periods ahead), confidence intervals (typically 95% or 99%), and seasonality parameters. Ignore outliers toggle helps when historical data contains anomalies that would skew predictions.
Limitations of Built-In Forecasting
Native forecasting works brilliantly for straightforward time-series predictions. But it hits walls quickly. Only line charts support forecasting. Bar charts, scatter plots, and other visualizations don’t get the feature. The algorithm handles single-variable predictions—sales over time, temperature trends, inventory depletion. Multi-variable regression models aren’t available. Complex scenarios demand more firepower. Customer churn prediction requires analyzing dozens of behavioral variables simultaneously. Pricing optimization needs elasticity modeling across product categories. Equipment failure prediction correlates sensor readings, maintenance logs, and environmental factors. That’s where Python, R, and Azure Machine Learning enter the picture.
Python Integration for Advanced Predictive Models
Power BI supports Python scripts for data transformation and custom visuals. Data scientists can build sophisticated machine learning models using scikit-learn, TensorFlow, or PyTorch libraries.
Setting Up Python in Power BI Desktop
First, install Python locally. Download from python.org or use Anaconda distribution (includes common data science packages pre-installed). In Power BI Desktop, navigate to File > Options and settings > Options > Python scripting. Set the Python home directory to the installation path. Power BI detects installed packages automatically. Required libraries for predictive analytics typically include pandas (data manipulation), NumPy (numerical computing), scikit-learn (machine learning algorithms), and matplotlib or seaborn (visualizations within Python visuals).
Building a Prediction Model with Python Script
Python scripts in Power BI run in two contexts: data transformation (Power Query Editor) or visualization (Python visual). For predictive modeling, the transformation approach works best. Import historical data, run the Python script to generate predictions, append predictions to the dataset, then visualize normally. Here’s a typical workflow for regression-based forecasting:
- Load historical data into Power BI
- Add Python script transformation in Power Query
- Import necessary libraries (pandas, scikit-learn)
- Prepare features and target variable
- Split data into training and testing sets
- Train the model (Linear Regression, Random Forest, etc.)
- Generate predictions
- Return augmented dataset with prediction column
Research shows standard practice splits datasets into 80% training data and 20% testing data, allowing models to learn patterns while validating accuracy on unseen observations. The Python script outputs a dataframe that becomes a table in Power BI. Predictions appear as regular columns, visualized alongside actuals for comparison.
R Integration as an Alternative Approach
R offers similar capabilities with different strengths. The R ecosystem excels at statistical modeling—time series analysis, survival analysis, Bayesian inference. According to Microsoft’s official Power BI Desktop September 2016 Feature Summary, the release allowed users to edit R visuals in their favorite R IDE, and with the Pyramid Analytics integration, this exemplified ways users can leverage other BI tools alongside Power BI Desktop. Setting up R mirrors Python configuration. Install R from r-project.org or Microsoft R Open (optimized for performance). Point Power BI to the R installation directory in Options. Popular R packages for predictive analytics include caret (unified interface for hundreds of models), forecast (time series methods), randomForest (ensemble learning), and glmnet (regularized regression). R visuals render as static images in published reports, which limits interactivity but eliminates runtime dependencies. Users view the visualization snapshot without needing R installed.
Azure Machine Learning Integration
Azure Machine Learning bridges the gap between data scientists building complex models and analysts creating reports. Models trained in Azure ML become callable functions within Power BI.
How the Integration Works
Data scientists use Azure Machine Learning Studio or Azure Databricks to develop models. They train on large datasets, tune hyperparameters, and deploy the best-performing model as a web service. Power BI connects to deployed Azure ML models through API endpoints. Dataflows or Power Query transformations pass data to the model, receive predictions, and integrate results into reports. This separation of concerns is powerful. Data scientists iterate on models using Python notebooks or AutoML. Analysts consume predictions without touching code. Model updates propagate automatically when new versions deploy to Azure. According to a Microsoft case study published September 1, 2021, a Fortune 500 pharmaceutical company headquartered in New Jersey leveraged Power BI, Azure, and ValQ for strategic planning, utilizing capabilities to perform predictive financial modeling and planning to inform improved business outcomes.
Microsoft Fabric and AI Integration
Microsoft Fabric unifies Power BI, Azure Synapse Analytics, and Azure Machine Learning into a single platform. The Data Science experience in Fabric provides notebooks, model training, and deployment—all accessible from the Power BI interface. According to Microsoft’s official tutorial, users can build Power BI reports from predictions data generated in Fabric, creating semantic models and adding measures to visualize predictions. Machine learning models in Fabric follow MLflow standards. Models include version tracking, hyperparameter logging, metrics, and schema definitions. Power BI accesses these through the Fabric lakehouse architecture. 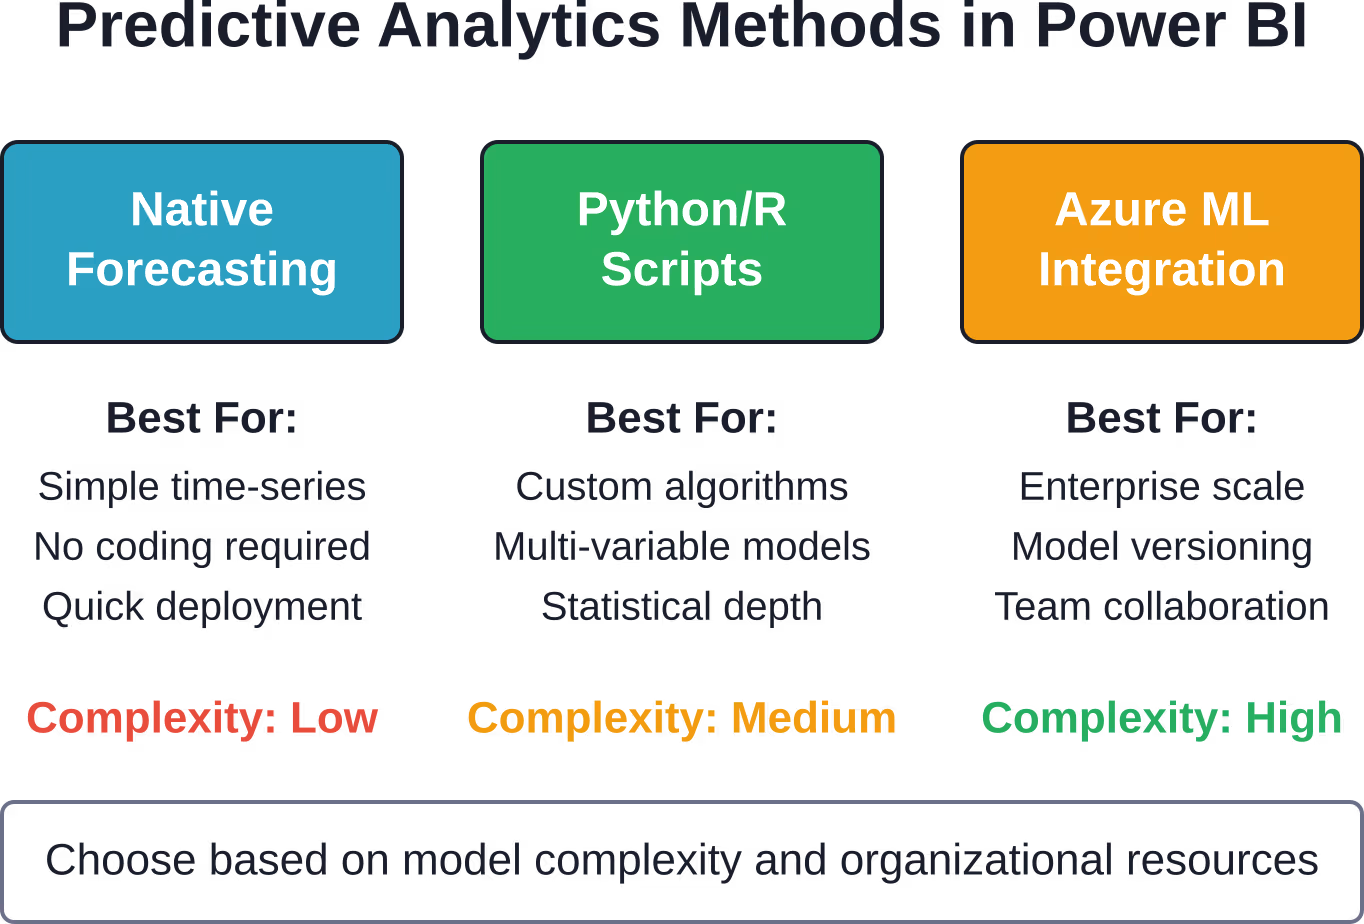
Real-World Use Cases Across Industries
Predictive analytics in Power BI isn’t theoretical. Organizations deploy it for tangible business outcomes.
Healthcare: Patient Readmission Prediction
Healthcare providers use predictive models to identify patients at high risk for hospital readmission. Models analyze diagnosis codes, medication adherence, previous admissions, demographics, and social determinants of health. Research shows predictive analytics can help achieve significant reductions in hospitalizations and emergency room visits through proactive intervention. Power BI dashboards surface risk scores for care coordinators. High-risk patients trigger automated follow-up workflows, home health visits, or medication management programs.
Retail: Customer Lifetime Value Forecasting
Retailers predict how much revenue each customer will generate over their relationship with the brand. Models incorporate purchase frequency, average order value, product preferences, and engagement metrics. Research shows predictive analytics tools can increase customer lifetime value significantly by removing guesswork and replacing it with clear insights about customer behavior patterns. Segmentation based on predicted lifetime value drives personalized marketing. High-value segments receive VIP treatment and exclusive offers. At-risk segments get retention campaigns.
Manufacturing: Predictive Maintenance
Equipment failures cost manufacturers millions in downtime and emergency repairs. Predictive maintenance models analyze sensor data—vibration, temperature, pressure, acoustics—to forecast failures before they occur. Power BI integrates with IoT platforms pulling real-time sensor streams. Machine learning models score each asset’s failure probability. Maintenance teams prioritize interventions based on risk and operational impact. Scheduled maintenance during planned downtime costs far less than emergency repairs halting production lines.
Marketing: Campaign Performance Optimization
Marketing teams predict campaign ROI before spending budget. Models trained on historical campaign data learn which channels, messages, audiences, and timing combinations drive conversions. Predictive analytics can help marketing teams identify which content and marketing strategies resonate with target audiences to optimize customer acquisition. Power BI dashboards compare predicted versus actual performance as campaigns run. Underperforming channels get reallocated mid-campaign.
Implementation Best Practices
Building predictive analytics capabilities requires more than installing software. Successful implementations follow clear principles.
Start with Clean, Quality Data
Garbage in, garbage out. Predictive models amplify data quality problems. Missing values, duplicates, inconsistent formatting, and outdated records poison model accuracy. Invest in data cleansing before model building. Power Query transformations handle common issues—removing nulls, standardizing dates, deduplicating records. According to Georgetown University analysis, statistical methods and predictive models examining existing data sets help understand customers and products while identifying opportunities and risks.
Choose the Right Modeling Technique
Not every problem needs deep learning. Simple linear regression often outperforms complex neural networks on small datasets.
| Problem Type | Recommended Technique | Complexity Level |
|---|---|---|
| Time-series forecasting | Exponential smoothing, ARIMA | Low to Medium |
| Binary classification (yes/no) | Logistic regression, decision trees | Medium |
| Multi-class classification | Random forest, gradient boosting | Medium to High |
| Regression (continuous values) | Linear regression, support vector machines | Medium |
| Anomaly detection | Isolation forest, autoencoders | High |
Match technique to data volume and problem complexity. Thousands of records support most algorithms. Millions enable deep learning. Dozens require simpler approaches or domain expertise augmentation.
Validate Model Performance Rigorously
Training accuracy means nothing. Test set performance matters. Split historical data into training and testing portions. Train on 80%, test on 20%. Better yet, use cross-validation—train on multiple subsets, validate on held-out folds, average results. Track appropriate metrics. Classification problems use accuracy, precision, recall, F1-score. Regression uses mean absolute error, root mean squared error, R-squared. Choose metrics aligned with business impact. A credit fraud model with 99% accuracy sounds impressive. But if fraud represents 1% of transactions, predicting “no fraud” every time achieves 99% accuracy while catching zero fraud. Precision and recall matter more.
Communicate Uncertainty Transparently
Predictions aren’t guarantees. Confidence intervals communicate uncertainty honestly. Power BI native forecasting includes confidence bands—shaded areas showing probable ranges. A sales forecast might predict 1,000 units with a 95% confidence interval of 850-1,150 units. Business leaders make better decisions with uncertainty quantified. “We’ll sell 1,000 units” invites disappointment. “We’ll sell 850-1,150 units with 95% confidence” sets realistic expectations and enables scenario planning.
Plan for Model Maintenance
Models degrade. Customer behavior shifts. Market conditions change. Seasonal patterns evolve. Schedule regular retraining—monthly, quarterly, or triggered by performance thresholds. Monitor prediction accuracy over time. Declining accuracy signals model drift requiring intervention. Version control matters. Track which model version generated which predictions. When investigating forecast errors, knowing the exact model, training data, and parameters used enables meaningful analysis.
Common Pitfalls and How to Avoid Them
Even experienced teams stumble implementing predictive analytics. Awareness prevents common mistakes.
Overfitting Training Data
Models that memorize training data fail spectacularly on new data. This overfitting appears as perfect training accuracy with abysmal test accuracy. Regularization techniques penalize model complexity. Simpler models generalize better. Cross-validation catches overfitting during development. If training accuracy is 98% but test accuracy is 65%, the model overfit.
Ignoring Business Context
Statistically significant doesn’t mean practically useful. A model predicting customer churn with 85% accuracy sounds great until realizing retention campaigns cost more than the predicted churn impact. Connect predictions to business decisions. What action will predictions trigger? At what probability threshold? What’s the cost of false positives versus false negatives? Technical teams and business stakeholders must align on these questions.
Insufficient Historical Data
Machine learning models need examples—hundreds minimum, thousands preferred, millions ideal for complex problems. Sparse data limits modeling options. With 50 customer records, sophisticated algorithms overfit immediately. Domain expertise and simple heuristics outperform machine learning in data-poor environments. Data augmentation helps marginally. Synthetic data generation, feature engineering, and transfer learning from related domains squeeze value from limited observations.
Neglecting Feature Engineering
Raw data rarely feeds models effectively. Feature engineering transforms raw inputs into meaningful predictors. Date fields become day of week, month, quarter, days since last event. Text becomes sentiment scores, topic classifications, word counts. Categorical variables become one-hot encoded binary flags. Domain knowledge drives feature engineering. Retail analysts know holiday proximity matters. Healthcare professionals know medication interactions matter. Subject matter experts guide which features to engineer.
Measuring Predictive Analytics ROI
Executive buy-in requires demonstrating value. Predictive analytics ROI comes in multiple forms.
Direct Cost Reduction
Predictive maintenance prevents expensive emergency repairs. Inventory optimization reduces carrying costs. Churn prediction retains customers cheaper than acquiring new ones. Calculate baseline costs before implementation. Measure cost reduction after deployment. The delta is direct ROI.
Revenue Increase
Better forecasting improves product availability during demand spikes. Targeted marketing increases conversion rates. Pricing optimization captures willingness to pay. Track revenue from predictive-informed decisions separately. A/B testing compares predictive recommendations against business-as-usual approaches.
Time Savings
Analysts spend less time generating reports and more time interpreting insights. Automated forecasting eliminates manual spreadsheet modeling. Data scientists focus on new problems instead of maintaining old models. Quantify hours saved weekly. Multiply by loaded labor cost. Time savings ROI appears quickly at scale.
Risk Mitigation
Fraud detection prevents losses. Compliance monitoring avoids regulatory fines. Supply chain risk modeling prevents disruptions. Risk mitigation ROI is trickier—measuring what didn’t happen. Compare incident rates pre- and post-implementation. Estimate cost per incident. Calculate prevented losses.
The Future of Predictive Analytics in Power BI
Microsoft continues investing heavily in AI capabilities across the Power Platform ecosystem. AutoML features democratize model building. Business analysts without data science backgrounds can train models through guided interfaces. The system selects algorithms, tunes hyperparameters, and validates performance automatically. Natural language querying expands. Instead of building visuals manually, users ask “show me predicted sales for next quarter by region” and Power BI generates appropriate forecasts and visualizations. Real-time predictive analytics becomes standard. DirectQuery connections enable streaming predictions on live data. IoT sensor streams feed models that score observations instantly. According to Microsoft’s Power BI Desktop October 2019 Feature Summary, automatic page refresh for DirectQuery was introduced (in preview), allowing users to trigger refreshes for DirectQuery-based reports at regular intervals. Integration deepens across Microsoft’s data platform. Fabric unifies data engineering, data science, and business intelligence. Models train in Synapse, deploy through Azure ML, and visualize in Power BI—all within one environment with shared governance and lineage tracking.
Getting Started: A Practical Roadmap
Organizations ready to implement predictive analytics in Power BI should follow a phased approach.
Phase 1: Assessment and Foundation (Weeks 1-4)
Identify high-impact use cases. Where do predictions create business value? Sales forecasting, customer segmentation, and resource optimization typically offer quick wins. Audit data availability and quality. Which datasets contain sufficient historical records? What cleaning and transformation is needed? Assess skill gaps. Does the team have Python or R expertise? Are data scientists available for complex models? Should the organization start with native forecasting?
Phase 2: Pilot Project (Weeks 5-12)
Select one manageable use case for proof of concept. Sales forecasting for a single product line. Churn prediction for high-value segment. Demand forecasting for top SKUs. Build the model using appropriate tools—native forecasting for simplicity, Python for custom logic, Azure ML for enterprise scale. Create Power BI dashboards surfacing predictions alongside actuals. Make it easy to compare forecast accuracy. Gather feedback from business users. Is the interface intuitive? Are predictions actionable? What refinements would increase value?
Phase 3: Expansion and Operationalization (Weeks 13-26)
Apply learnings from pilot to additional use cases. Standardize model development processes. Document best practices. Establish model governance. Who approves new models? How often do models retrain? What performance thresholds trigger alerts? Build organizational capability. Train analysts on Power BI predictive features. Upskill data scientists on Azure ML integration. Create internal communities of practice.
Phase 4: Continuous Improvement (Ongoing)
Monitor model performance religiously. Track prediction accuracy over time. Investigate accuracy degradation quickly. Iterate based on business impact. Which predictions drive the most value? Where should the team invest additional modeling effort? Stay current with Power BI updates. Microsoft ships new features monthly. According to Microsoft’s April 2021 feature summary, API v3.6.0 is available with continuous enhancements to platform capabilities. Share successes across the organization. When predictive analytics delivers ROI, evangelize wins to build support for expanded investment.
Frequently Asked Questions
Can Power BI do predictive analytics without Python or R?
Yes. Power BI includes native forecasting capabilities that work directly on line chart visualizations without any coding. The feature uses exponential smoothing algorithms to detect seasonality and generate forecasts with confidence intervals. It’s ideal for time-series predictions like sales forecasting, demand planning, and trend analysis. For more complex multi-variable predictions, Python, R, or Azure Machine Learning integration becomes necessary.
How accurate are Power BI’s built-in forecasting models?
Accuracy depends entirely on data quality and pattern stability. Clean time-series data with consistent seasonality produces reliable forecasts. Erratic data with sudden shifts yields poor predictions. Native forecasting works best with at least 24 data points, though more improves accuracy. Always validate forecasts against held-out test data before trusting predictions. Power BI displays confidence intervals to communicate prediction uncertainty—wider bands indicate less certainty.
What’s the difference between Power BI forecasting and Azure Machine Learning?
Power BI native forecasting handles simple time-series predictions using exponential smoothing—one variable over time. Azure Machine Learning supports complex multi-variable models, classification problems, deep learning, and custom algorithms. Azure ML provides model versioning, A/B testing, automated retraining, and production-grade deployment. Choose Power BI forecasting for quick sales or demand forecasts. Choose Azure ML for customer churn prediction, pricing optimization, or any scenario requiring multiple input variables.
Can Power BI handle real-time predictive analytics?
Yes, through DirectQuery connections and automatic page refresh features. DirectQuery pulls live data from source systems without importing. Automatic page refresh (introduced in October 2019) triggers report refreshes at defined intervals. Combined, these enable near-real-time predictions—sensor data feeds models that score observations continuously. IoT scenarios, fraud detection, and operational monitoring benefit from this capability. Refresh frequency balances freshness against query performance and resource consumption.
Do I need a special Power BI license for predictive analytics?
Native forecasting works in Power BI Desktop (free) and all Power BI Service tiers. Python and R visuals work in Desktop but have limitations in Service—they require gateway configuration for refresh. Azure Machine Learning integration requires both Power BI Premium or Premium Per User licenses and Azure subscriptions for the ML services. Microsoft Fabric (which unifies Power BI and Azure ML) requires Fabric capacity licenses. Check Microsoft’s official pricing page for current tier details and feature availability.
How much historical data do I need for predictive modeling?
Minimum viable amounts depend on model complexity. Simple time-series forecasting needs at least two full seasonal cycles (24 months for monthly data). Classification models need hundreds of examples per class—500+ preferred. Regression models need enough examples to capture variable relationships—typically hundreds to thousands. Deep learning requires thousands to millions. More data generally improves accuracy, but quality matters more than quantity. Clean, representative data beats massive noisy datasets.
What happens when predictions are wrong?
All predictions carry uncertainty. Wrong predictions signal issues requiring investigation. Model drift occurs when business conditions change—customer behavior shifts, market dynamics evolve, seasonal patterns break. Investigate prediction errors systematically. Compare predicted versus actual values. Identify patterns in errors (consistently high, low, or random). Retrain models with recent data incorporating new patterns. Adjust confidence intervals to communicate uncertainty honestly. Track accuracy metrics over time to detect degradation early.
Conclusion
Predictive analytics transforms Power BI from a reporting tool into a decision intelligence platform. Native forecasting delivers quick wins for straightforward time-series predictions. Python and R integration unlocks custom algorithms and advanced statistical techniques. Azure Machine Learning integration provides enterprise-scale model deployment and governance. Real-world applications span industries—healthcare reduces readmissions, retail increases customer lifetime value, manufacturing prevents equipment failures, marketing optimizes campaigns. Organizations implementing predictive analytics report measurable ROI through cost reduction, revenue increase, time savings, and risk mitigation. Success requires clean data, appropriate modeling techniques, rigorous validation, transparent uncertainty communication, and ongoing model maintenance. Common pitfalls—overfitting, ignoring business context, insufficient data, poor feature engineering—are avoidable with awareness and discipline. The future brings democratized AI through AutoML, natural language interfaces, real-time predictions, and deeper platform integration through Microsoft Fabric. Start small. Pick one high-impact use case. Build a pilot. Demonstrate value. Expand systematically. Power BI’s predictive capabilities are ready. The question isn’t whether to adopt predictive analytics—it’s how quickly organizations can harness predictions to outpace competitors still driving by looking in the rearview mirror.