Quick Summary: Predictive analytics in Excel enables forecasting future outcomes using historical data through built-in functions like FORECAST.ETS and FORECAST.LINEAR, regression analysis via the Analysis ToolPak, and time series modeling. Excel’s accessible interface makes statistical forecasting and trend prediction practical for business analysts without requiring advanced programming skills.
Excel remains one of the most accessible tools for predictive analytics, despite the rise of specialized data science platforms. The software combines statistical rigor with an interface familiar to millions of business professionals.
Predictive analytics uses historical data patterns to forecast future outcomes. When applied in Excel, these techniques transform spreadsheet data into actionable forecasts—whether projecting next quarter’s sales, estimating inventory needs, or anticipating customer behavior.
This guide covers practical predictive analytics techniques that Excel users can implement immediately, from simple forecasting functions to regression modeling and time series analysis.
Understanding Predictive Analytics in Excel
Predictive analytics examines patterns in historical data to make informed predictions about future events. Excel provides several approaches to this challenge, each suited to different data types and forecasting scenarios.
The core principle remains consistent: analyze what happened before to estimate what will happen next. Excel translates this principle into formulas and tools accessible to analysts without programming backgrounds.
Three primary techniques dominate Excel-based predictive analytics:
- Built-in forecasting functions for quick predictions
- Linear regression models for understanding variable relationships
- Time series analysis for trend and seasonality patterns
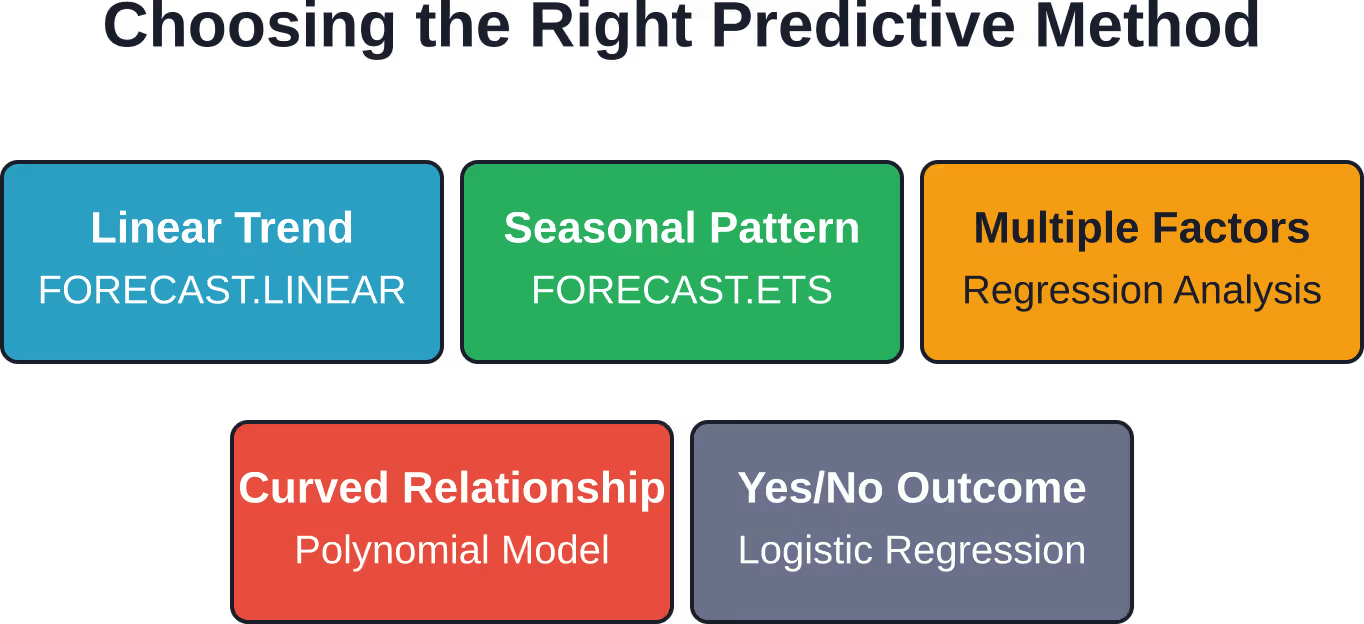
Each method serves specific use cases. Choosing the right approach depends on data structure, the question being asked, and the level of accuracy required.

Use Predictive Analytics with AI Superior
AI Superior helps build predictive models that can be connected to tools like Excel for analysis and reporting.
The focus is on developing models externally and linking outputs to familiar tools used by teams.
Looking to Add Predictive Analytics to Excel?
AI Superior can help with:
- building predictive models
- connecting outputs to Excel workflows
- integrating models into existing processes
- refining results over time
👉 Contact AI Superior to discuss your project, data, and implementation approach
Excel Forecasting Functions
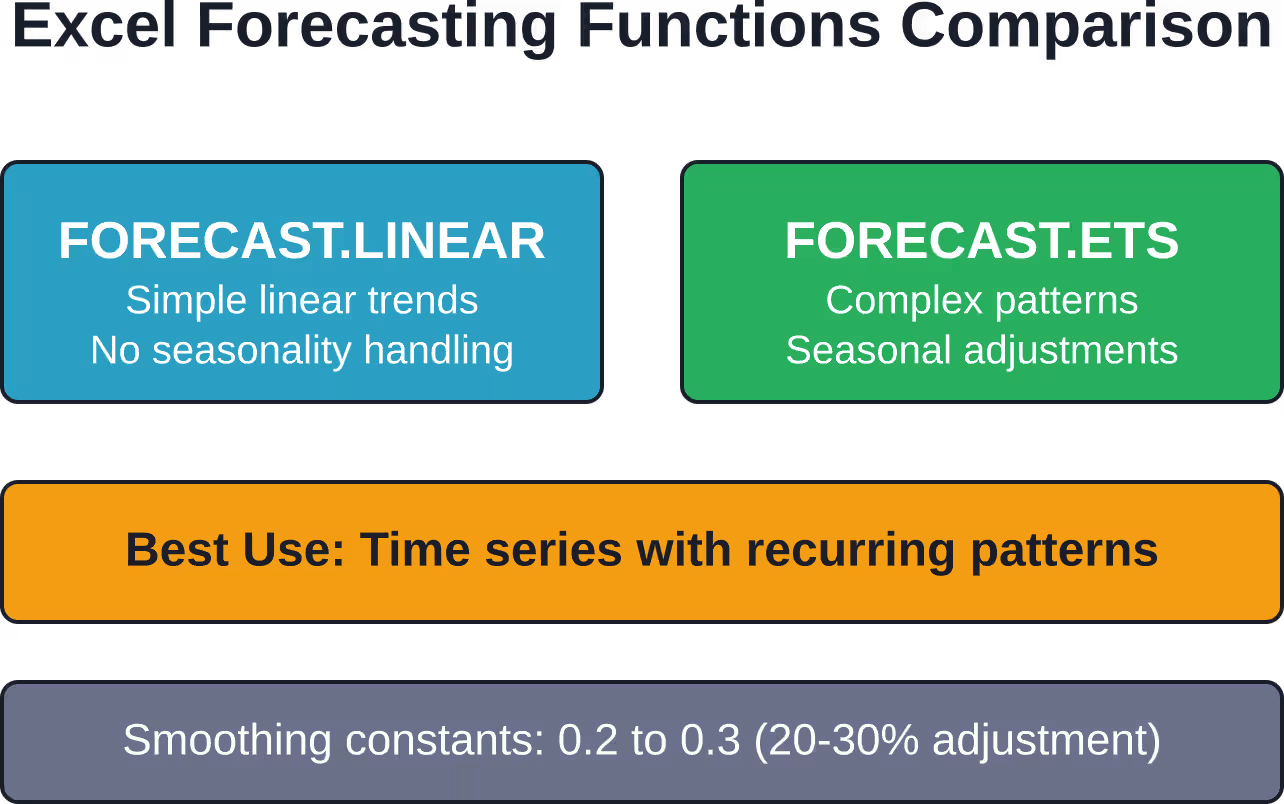
Microsoft Excel includes native forecasting functions that provide immediate predictive capabilities. The FORECAST.LINEAR function and FORECAST.ETS function represent the two most commonly used tools.
FORECAST.LINEAR for Simple Projections
The FORECAST.LINEAR function predicts future values based on linear regression. According to Microsoft documentation, this function replaced the legacy FORECAST function to provide clearer naming conventions.
The syntax follows this structure:
| =FORECAST.LINEAR(x, known_y’s, known_x’s) |
Where x represents the data point to predict, known_y’s contains historical values, and known_x’s contains corresponding time periods or independent variables.
For example, to forecast month 7 sales when historical data spans months 1-6, the function analyzes the linear relationship between months and sales values, then extends that trend forward.
FORECAST.ETS for Time Series Data
The FORECAST.ETS function handles more complex time series data with seasonality and trends. Microsoft provides this exponential smoothing function in Excel to address limitations of simpler forecasting approaches.
The syntax expands to accommodate seasonality:
| =FORECAST.ETS(target_date, values, timeline, [seasonality], [data_completion], [aggregation]) |
According to Microsoft support documentation, smoothing constants between 0.2 to 0.3 are reasonable values, indicating that the current forecast should be adjusted 20 percent to 30 percent for error in the prior forecast.
This function excels when data exhibits recurring patterns—monthly sales cycles, seasonal inventory fluctuations, or quarterly performance trends.
Regression Analysis for Predictive Modeling
Regression analysis forms the foundation of many predictive models. This technique identifies relationships between variables—how changes in one factor influence changes in another.
Excel’s Analysis ToolPak provides regression capabilities that rival specialized statistical software for many business forecasting scenarios.
Setting Up the Analysis ToolPak
The Analysis ToolPak is an Excel add-in that must be activated before use. Navigate to File → Options → Add-ins, then select Excel Add-ins from the dropdown and check Analysis ToolPak.
Once loaded, the Data Analysis option appears in the Data tab ribbon, providing access to regression and other statistical tools.
Building a Linear Regression Model
Linear regression predicts a dependent variable (what to forecast) based on one or more independent variables (factors that influence the outcome).
The process follows these steps:
- Organize data with independent variables in columns and the dependent variable in its own column
- Select Data → Data Analysis → Regression
- Define the Input Y Range (dependent variable) and Input X Range (independent variables)
- Choose an output location for results
- Click OK to generate the regression statistics
The output includes multiple statistical measures. The R-squared value indicates model fit—how much variance in the dependent variable the model explains. Industry analyses suggest R-squared values above 0.7 indicate reasonable predictive power, though context matters significantly.
According to competitor content, an R-squared value of 0.953 means the regression line explains 95% of the variance—a strong indicator of model reliability.
Interpreting Regression Results
The regression output provides coefficients for each independent variable. These coefficients reveal the magnitude and direction of each variable’s influence on the prediction.
A positive coefficient indicates that increases in the independent variable correspond to increases in the dependent variable. Negative coefficients signal inverse relationships.
The p-value for each coefficient tests statistical significance. Values below 0.05 typically indicate the relationship is unlikely due to random chance.
| Regression Output | What It Means | Good Values |
|---|---|---|
| R-squared | Percentage of variance explained by model | 0.7 to 1.0 |
| Adjusted R-squared | R-squared adjusted for number of variables | Close to R-squared |
| Coefficients | Impact magnitude of each variable | Statistically significant |
| P-value | Statistical significance test | Below 0.05 |
| Standard Error | Average distance from regression line | Lower is better |
Time Series Analysis Techniques
Time series data—information collected at regular intervals—requires specialized forecasting approaches. Sales data, website traffic, inventory levels, and financial metrics all generate time series that exhibit trends and patterns.
Excel handles time series analysis through several methods, from simple moving averages to the exponential smoothing implemented in FORECAST.ETS.
Moving Averages
Moving averages smooth out short-term fluctuations to reveal underlying trends. Calculate a moving average by averaging a fixed number of recent data points, then sliding that window forward through the dataset.
A 3-month moving average, for example, averages the current month with the two preceding months. As new data arrives, the oldest value drops out and the newest value enters the calculation.
This technique works well for identifying trend direction without the complexity of statistical functions.
Exponential Smoothing
Exponential smoothing improves on moving averages by weighting recent observations more heavily than older ones. The technique assumes recent data points contain more relevant information for forecasting.
Microsoft’s guidance indicates smoothing constants between 0.2 and 0.3 work well for most business scenarios. Higher values increase responsiveness to recent changes but can produce erratic projections.
The FORECAST.ETS function implements exponential smoothing automatically, handling the mathematical complexity behind a simple function interface.
Practical Forecasting Example
Real-world application clarifies abstract concepts. Consider a scenario documented in Microsoft support forums: forecasting association fee income based on historical financial data.
The dataset spans 2009-2017 with annual income figures. To forecast 2018 income, analysts calculated a 5-year average from 2013-2017 data, resulting in a baseline of $50,917.60. The forecast for 2018 came to $53,094.39 for total income.
This example demonstrates a fundamental forecasting principle: recent data often predicts better than distant history. The 5-year window captured current trends while excluding potentially obsolete patterns from 2009-2012.
Sales Forecasting Scenario
Another Microsoft documentation example shows sales forecasting from 2010-2018 data. Historical sales figures ranged from 28,318 to 57,366 units across those years, exhibiting both growth and decline periods.
To project sales for 2019-2025, the FORECAST.ETS function would identify underlying trends while accounting for the cyclical pattern visible in the historical data—growth through 2013, decline through 2017, then recovery in 2018.
The function automatically detects these patterns and extends them forward, providing multi-year forecasts without manual calculation of trend components.
Model Accuracy and Validation
Predictive models generate numbers, but those numbers only matter if they’re accurate. Validation techniques separate useful forecasts from statistical noise.
Holdout Validation
Split historical data into training and testing sets. Build the model using the training data, then compare predictions against the held-out test data that the model never saw.
If predictions closely match actual test values, the model likely generalizes well to truly future data.
Residual Analysis
Residuals represent the difference between predicted and actual values. Plot residuals against predicted values or time periods to check for patterns.
Random scatter indicates a good model. Systematic patterns in residuals suggest the model misses important relationships or trends.
Continuous Monitoring
Models degrade over time as business conditions change. Compare ongoing forecasts against actual results, recalibrating when accuracy drops below acceptable thresholds.
Some organizations rebuild predictive models quarterly or annually to incorporate fresh data and evolving patterns.
| Validation Method | Purpose | When to Use |
|---|---|---|
| Holdout Testing | Test model on unseen data | Initial model building |
| Residual Plots | Check for systematic errors | After regression analysis |
| Mean Absolute Error | Measure average prediction error | Comparing multiple models |
| Backtesting | Simulate historical predictions | Time series validation |
Common Pitfalls in Excel Predictive Analytics
Even experienced analysts encounter obstacles when implementing predictive analytics in Excel.
Overfitting Models
Adding more independent variables to a regression model increases R-squared values even when those variables lack genuine predictive power. The model fits historical data perfectly but fails to predict new outcomes.
The adjusted R-squared metric compensates for this by penalizing excessive variables. A large gap between R-squared and adjusted R-squared signals potential overfitting.
Ignoring Data Quality
Predictive models amplify data quality issues. Missing values, outliers, and inconsistent formats corrupt forecasts.
Clean data thoroughly before analysis. Address missing values through deletion or imputation, investigate outliers for validity, and standardize units and formats.
Assuming Linear Relationships
Not all relationships follow straight lines. Some variables exhibit exponential, logarithmic, or polynomial relationships that linear regression misses entirely.
Plot data before modeling to identify non-linear patterns that require transformation or alternative techniques.
Extrapolating Beyond Data Range
Models trained on historical data may not apply to unprecedented future conditions. Forecasting during market disruptions, new competitor entry, or regulatory changes requires caution.
Document assumptions underlying forecasts and adjust when those assumptions no longer hold.
Advanced Excel Predictive Techniques
Beyond built-in functions and the Analysis ToolPak, Excel supports more sophisticated predictive analytics through add-ins and custom formulas.
Multiple Regression Models
Single-variable regression rarely captures business complexity. Multiple regression incorporates several independent variables simultaneously—price, marketing spend, seasonality, and economic indicators all influencing sales, for example.
The Analysis ToolPak handles multiple regression by selecting multiple columns as the Input X Range during regression setup.
Polynomial Regression
When relationships follow curves rather than straight lines, polynomial regression adds squared or cubed terms to capture non-linear patterns.
Create polynomial terms manually by adding columns that square or cube original variables, then include those engineered features in the regression input range.
Logistic Regression for Classification
Not all predictions involve continuous numbers. Classification problems—will a customer churn, will a lead convert, will equipment fail—require different approaches.
Excel can perform logistic regression through Solver add-in, though this requires more manual setup than linear regression.
Frequently Asked Questions
What is the difference between FORECAST.LINEAR and FORECAST.ETS in Excel?
FORECAST.LINEAR performs simple linear regression to project trends in a straight line, suitable for data without seasonal patterns. FORECAST.ETS uses exponential smoothing to handle complex time series with seasonality, trends, and cyclical patterns. For monthly sales data with recurring seasonal peaks, FORECAST.ETS provides more accurate predictions.
How accurate is predictive analytics in Excel compared to specialized software?
Excel’s predictive analytics capabilities match specialized software for many business forecasting scenarios, particularly linear regression, time series forecasting, and basic statistical models. The Analysis ToolPak provides statistically rigorous calculations. However, specialized platforms offer advantages for machine learning algorithms, big data processing, and automated model selection that Excel cannot match.
Do I need the Analysis ToolPak for predictive analytics in Excel?
Not for basic forecasting—FORECAST.LINEAR and FORECAST.ETS work without any add-ins. The Analysis ToolPak becomes necessary for regression analysis, correlation matrices, histogram generation, and other advanced statistical functions. Activate it through File → Options → Add-ins when deeper analysis is required.
What is a good R-squared value for a predictive model in Excel?
R-squared values above 0.7 generally indicate the model explains a substantial portion of variance, though context matters significantly. Business and social science models often achieve R-squared between 0.5 and 0.8, while physical science models may exceed 0.9. Focus on whether the model provides actionable predictions for the specific business problem rather than chasing perfect statistical scores.
How much historical data do I need for accurate forecasts in Excel?
Minimum data requirements depend on the forecasting technique and data frequency. For FORECAST.LINEAR, at least 10-15 data points provide reasonable trend estimates. For FORECAST.ETS with seasonality, multiple complete cycles are needed—at least 2-3 years of monthly data to capture seasonal patterns reliably. More data generally improves accuracy, though very old data may reflect outdated conditions.
Can Excel handle large datasets for predictive analytics?
Excel’s row limit is 1,048,576 rows, sufficient for many business forecasting scenarios. Performance degrades with extremely large datasets or complex formulas across hundreds of thousands of rows. For datasets exceeding several hundred thousand rows or requiring real-time processing, database tools or specialized analytics platforms become more appropriate.
How do I validate that my Excel forecast is accurate?
Split historical data into training and testing sets—build the model on 70-80% of data, then compare predictions against the remaining 20-30% that the model did not see. Calculate mean absolute error or mean absolute percentage error between predictions and actuals. Additionally, plot residuals to check for systematic patterns that indicate model problems. Regularly compare ongoing forecasts against actual outcomes to monitor model degradation.
Conclusion
Predictive analytics transforms Excel from a simple calculation tool into a forecasting engine. The combination of built-in functions like FORECAST.ETS and FORECAST.LINEAR, the Analysis ToolPak’s regression capabilities, and time series techniques provides analysts with practical forecasting power.
Success requires understanding when to apply each technique. Linear forecasting works for simple trends, exponential smoothing handles seasonality, and regression analysis reveals variable relationships.
But technical capability means nothing without data quality and validation discipline. Clean data thoroughly, test models rigorously, and monitor forecast accuracy continuously.
Start with the simplest technique that addresses the forecasting question. Built-in functions often suffice before reaching for advanced regression models.
The accessibility of Excel makes predictive analytics available to analysts who lack programming skills or access to specialized platforms. With the techniques covered here, spreadsheet users can generate data-driven forecasts that inform better business decisions.
Apply these methods to actual datasets, validate results against known outcomes, and refine approaches based on accuracy metrics. Predictive analytics is learned through practice more than theory.