
Quick Summary: Machine learning transforms sales forecasting by analyzing vast datasets to identify patterns traditional methods miss, achieving accuracy improvements measured in MAPE reductions of 3-7× compared to traditional methods. ML models like Random Forest and XGBoost adapt continuously to changing market conditions, handling complex variables from seasonality to customer behavior. Real-world implementations show MAPE scores as low as 6.67% for certain product categories, dramatically reducing inventory costs and improving revenue planning.
Sales forecasting has always been part art, part science. The art relied on seasoned reps making educated guesses. The science? Mostly spreadsheets filled with historical data and rudimentary trend lines.
That approach worked when markets moved predictably. But now? Customer behavior shifts overnight, supply chains fluctuate wildly, and competitors pivot strategies faster than quarterly reports can capture.
Machine learning changes the equation entirely. Instead of relying on linear projections, ML algorithms process thousands of variables simultaneously—historical sales patterns, seasonal fluctuations, market trends, economic indicators, even weather data. The result isn’t just incremental improvement. It’s a fundamental shift in how accurately businesses can predict future revenue.
Why Traditional Sales Forecasting Falls Short
Traditional forecasting methods depend heavily on historical averages and manual adjustments. A sales manager looks at last quarter’s numbers, applies a growth percentage, and calls it a forecast.
The problem? Markets don’t move in straight lines. By 2026, approximately 28% of companies achieve forecast accuracy within 5% of actual revenue, following the widespread adoption of AI-driven predictive analytics.That means 72% of businesses are making critical decisions—hiring plans, inventory purchases, capacity investments—based on flawed projections.
Manual methods also struggle with intermittent demand patterns. Research analyzing inventory forecasting datasets found that 70.06% of daily time series exhibit intermittent demand patterns, while 23.48% show lumpy demand characteristics.. Traditional statistical methods can’t effectively model these irregular patterns.
And here’s the thing: sales teams often inject optimism bias into forecasts. It’s human nature. Reps round up their pipeline probabilities. Managers add “stretch goals” that skew baseline predictions. Machine learning removes that emotional layer entirely.
How Machine Learning Transforms Forecasting Accuracy
ML models don’t guess. They identify relationships in data that human analysts would never spot—correlations between seemingly unrelated variables that nonetheless predict sales outcomes.
Take seasonality. Traditional methods might account for quarterly patterns. But ML algorithms detect micro-seasonality: the fact that sales spike on certain days of the month, or that specific product categories correlate with weather patterns in regional markets.
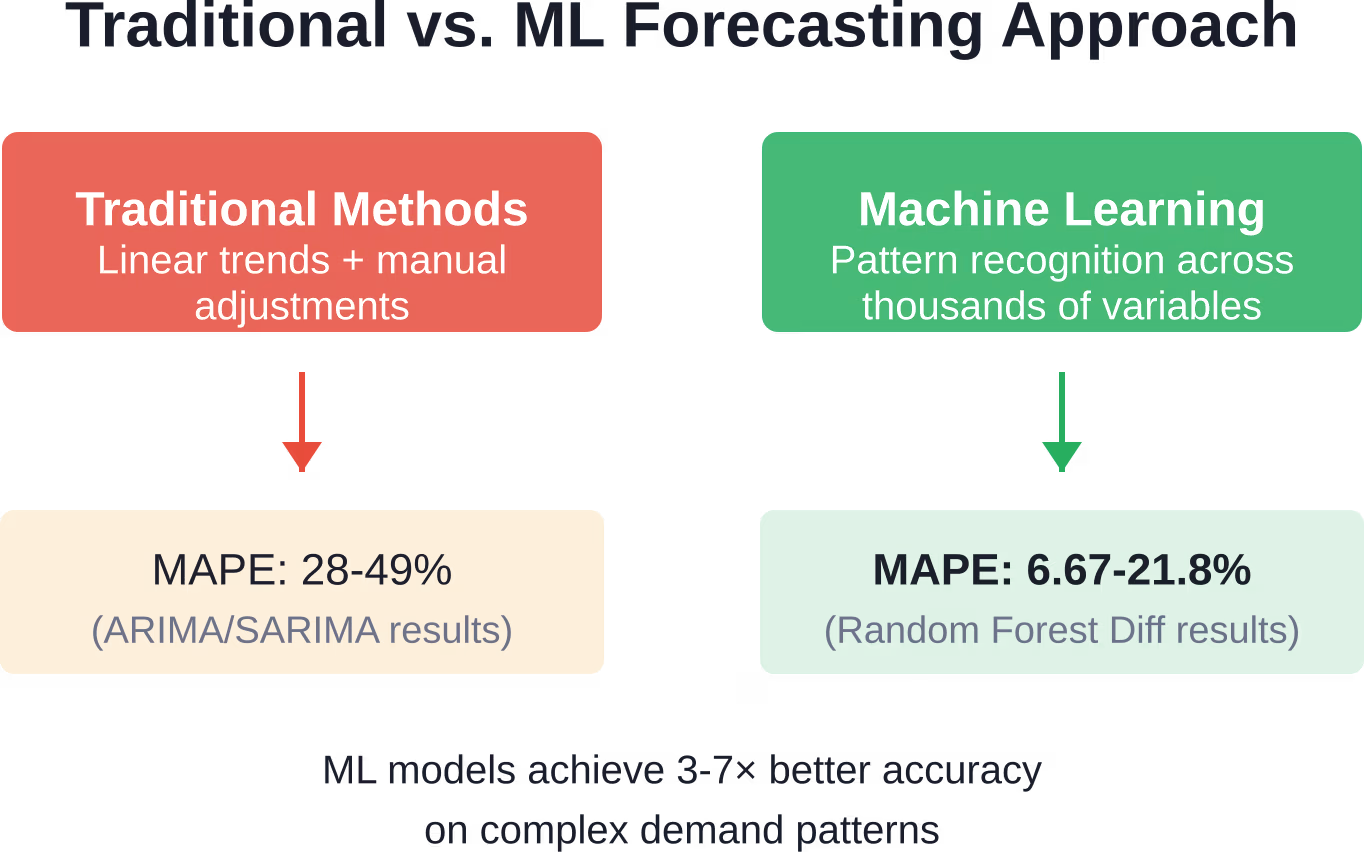
The accuracy improvements are measurable. Comparative studies of forecasting methods show Random Forest Diff achieving MAPE of 6.67% for Product A, while traditional ARIMA methods reached 28.57% MAPE on the same dataset. For another product line, Random Forest Diff scored 21.80% compared to SARIMA’s 49.30%.
That’s not marginal improvement. That’s the difference between confident inventory planning and chronic overstock or stockout situations.

Build Machine Learning Software With AI Superior
AI Superior develops custom AI software, including machine learning models, predictive analytics tools, and AI-based web and mobile applications. Their team supports projects from discovery and data review to MVP development, integration, and result evaluation.
For sales forecasting, this can support revenue prediction, pipeline analysis, demand planning, lead scoring, or reporting tools built around existing sales data.
Need Machine Learning Built Around Your Data?
AI Superior can help with:
- building custom machine learning solutions
- developing predictive analytics tools
- testing ideas through PoC or MVP development
- integrating AI into existing systems
👉 Contact AI Superior to discuss your project.
Core Machine Learning Models for Sales Forecasting
Different ML algorithms excel at different forecasting challenges. No single model dominates every scenario.
Random Forest
Random Forest builds hundreds of decision trees, each trained on slightly different subsets of the data. When making a prediction, the model aggregates results from all trees—hence “forest.”
The strength? Handling non-linear relationships and avoiding overfitting. Random Forest naturally captures interactions between variables without requiring manual feature engineering.
Performance data shows Random Forest achieving MAPE scores of 24.30% (Product A) to 35.05% (Product B) in baseline implementations, with differentiated versions (Random Forest Diff) improving to 6.67-21.80% by incorporating specialized preprocessing.
XGBoost (Extreme Gradient Boosting)
XGBoost builds trees sequentially, with each new tree correcting errors from previous ones. It’s exceptionally fast and handles missing data gracefully—critical for real-world sales datasets where data quality is rarely perfect.
Benchmark studies recorded XGBoost MAPE of 25.06% for Product A, 41.62% for Product B, and 19.51% for Product C in comparative tests. The variance across products highlights an important reality: model performance depends heavily on the characteristics of each specific sales pattern.
Neural Networks and Deep Learning
Neural networks excel when massive datasets are available and relationships are highly complex. They’re particularly effective for time series data with multiple seasonality layers—daily, weekly, monthly, and annual patterns overlapping.
The tradeoff? They require substantial training data and computational resources. For many mid-sized businesses, simpler models deliver better ROI.
Ensemble Methods
Increasingly, organizations combine multiple models rather than betting on a single algorithm. An ensemble might blend Random Forest predictions with XGBoost outputs and time series models, weighting each based on recent performance.
Research on stack-based ensemble models for demand forecasting demonstrates that combining complementary algorithms often outperforms any individual model, especially when dealing with diverse product portfolios.
Understanding Demand Pattern Complexity
Not all sales data looks the same. The pattern characteristics fundamentally shape which ML approach works best.
Analysis of large-scale inventory forecasting datasets reveals distinct demand classifications. The distribution matters because intermittent and lumpy patterns break traditional statistical assumptions.
Intermittent demand—characterized by periods of zero sales interspersed with sporadic purchases—represents 70% of the dataset. Traditional time series methods like ARIMA assume continuous, relatively smooth patterns. They fail catastrophically on intermittent data.
Machine learning handles this differently. Random Forest and XGBoost don’t assume continuity. They model the conditional probabilities: given certain features, what’s the likelihood of a sale occurring, and if one occurs, what magnitude?
Critical Implementation Steps
Building an effective ML forecasting system isn’t just about picking an algorithm and pressing “train.” The quality of implementation determines whether the model delivers value or just burns resources.
Data Collection and Preparation
Garbage in, garbage out. The model is only as good as the data feeding it.
Start by aggregating every relevant data source: historical sales transactions, CRM pipeline data, marketing campaign schedules, pricing changes, competitor actions (where observable), economic indicators, and seasonality markers.
Data quality issues plague real-world implementations. The inventory forecasting dataset analyzed in authoritative studies exhibited approximately 0.50 global average missingness in the training set and 0.30 in the validation set. Coverage ratios—the proportion of time periods with actual data—averaged 0.63 in training and 0.82 in validation.
Handling missing data matters enormously. Options include forward-fill (carrying the last known value), interpolation, or model-based imputation. The right choice depends on why data is missing. Random gaps? Interpolate. Systematic absence (new product launch)? Flag it explicitly.
Feature Engineering
Raw data rarely arrives in model-ready format. Feature engineering transforms raw inputs into predictive signals.
For sales forecasting, valuable engineered features include: lag variables (sales from 7, 14, 30 days ago), rolling averages (7-day, 30-day mean sales), rate of change (week-over-week growth), seasonality indicators (day of week, month, quarter, holiday proximity), and cumulative metrics (year-to-date sales, days since last purchase).
The goal isn’t creating every possible feature. It’s identifying which transformations expose patterns that predict future sales.
Train-Test Split Strategy
A standard practice is to use 80% of the dataset for training and 20% for testing.
But here’s the catch with time series: the split must respect temporal order. Train on older data, test on newer data. Never shuffle randomly—that leaks future information into the training set, creating artificially inflated performance metrics that collapse in production.
Model Selection and Tuning
Start simple. Benchmark a basic model first—even a naive forecast that assumes tomorrow equals today. That baseline reveals whether added complexity actually improves predictions.
Then iterate through candidate models: Random Forest, XGBoost, gradient boosting variants. Use cross-validation designed for time series—walk-forward validation, where the model trains on expanding windows of historical data and tests on the immediately following period.
Hyperparameter tuning refines performance. For Random Forest: number of trees, maximum depth, minimum samples per leaf. For XGBoost: learning rate, tree depth, regularization parameters.
Evaluation Metrics
MAPE (Mean Absolute Percentage Error) is widely used because it’s interpretable—a MAPE of 15% means predictions are off by 15% on average.
But MAPE has a weakness: it’s undefined when actual values are zero, problematic for intermittent demand. Alternatives include MAE (Mean Absolute Error) for absolute magnitude errors, or RMSE (Root Mean Squared Error) which penalizes large errors more heavily.
Choose the metric that aligns with business impact. Overstocking costs differ from understocking costs? Use an asymmetric loss function that reflects those economics.
Real-World Performance Benchmarks
Theory matters less than results. How do these models actually perform when implemented?
| Model | Product A MAPE | Product B MAPE | Product C MAPE |
|---|---|---|---|
| Random Forest | 24.30% | 35.05% | 30.79% |
| Random Forest Diff | 6.67% | 21.80% | 15.84% |
| XGBoost | 25.06% | 41.62% | 19.51% |
| ARIMA | 28.57% | 49.30% | 33.56% |
The data reveals several insights. First, differentiated preprocessing (the “Diff” variant) dramatically improves Random Forest performance—cutting MAPE by 73% for Product A.
Second, no universal winner exists. XGBoost edges out Random Forest on Product C (19.51% vs. 30.79%), but Random Forest Diff dominates Products A and B.
Third, traditional statistical methods (ARIMA) consistently underperform. The gap widens on complex products—SARIMA’s 49.30% on Product B versus Random Forest Diff’s 21.80%.
When Machine Learning Delivers Maximum Value
ML forecasting isn’t universally superior to all alternatives. Context determines whether the investment pays off.
High-Volume, High-Complexity Scenarios
Organizations with thousands of SKUs, multiple sales channels, and complex demand drivers gain the most. The ML model can’t just analyze more variables than a human—it can maintain separate learned patterns for each product-channel combination.
Retail operations with diverse inventories see substantial benefit. The inventory forecasting dataset that demonstrated 70.06% intermittent demand contained 70,201 training series and 54,454 validation series. Managing that complexity manually is impossible.
Dynamic, Fast-Changing Markets
When market conditions shift rapidly, models that adapt quickly deliver competitive advantage. XGBoost and neural networks can retrain on fresh data weekly or even daily, incorporating the latest signals into predictions.
Traditional forecasting relies on stable historical patterns. When those patterns break—new competitor, sudden trend shift, supply chain disruption—manual forecasts lag reality for months.
Limited When Data Is Scarce
ML models need substantial training data. Launching a brand-new product with zero sales history? Machine learning can’t help much. It has nothing to learn from.
In low-data scenarios, hybrid approaches work better: use domain expertise and analogous product data to seed initial forecasts, then transition to ML as data accumulates.
Common Implementation Challenges
Real talk: most ML forecasting projects hit obstacles. Being aware of common pitfalls helps navigate them.
Data Integration Complexity
Sales data lives in the CRM. Inventory data lives in the ERP. Marketing campaign data lives in yet another system. Web traffic data lives in analytics platforms.
Consolidating these disparate sources into a unified dataset for model training is often the hardest part of the entire project—harder than the actual ML work.
Model Drift and Maintenance
A model trained on 2024 data might perform brilliantly in early 2025, then gradually degrade as market conditions shift. Model drift—when real-world patterns diverge from training data—is inevitable.
Continuous monitoring is essential. Track prediction accuracy over time. When performance degrades beyond threshold, retrain on recent data.
Organizational Adoption Resistance
Sales teams sometimes resist ML forecasts, especially when predictions conflict with their intuition. “The model doesn’t understand our customer relationships” is a common pushback.
The solution isn’t forcing adoption. It’s building trust gradually: start with pilot projects, show comparative accuracy over time, involve sales leadership in defining success metrics, and preserve space for human override while tracking when those overrides improve versus harm accuracy.
Enhancing Models with External Data
Internal historical sales data is foundational. But external data sources can sharpen predictions substantially.
Economic indicators—GDP growth, unemployment rates, consumer confidence indices—correlate with purchase behavior. B2B companies might track manufacturing indexes or construction spending relevant to their customer base.
Weather data predicts demand for numerous product categories, from obvious cases like ice cream and winter coats to less intuitive connections like hardware store traffic and home improvement project activity.
Competitor pricing and promotional activity, when observable through web scraping or market research services, helps anticipate demand shifts driven by competitive dynamics rather than internal factors.
Building Versus Buying Forecasting Solutions
Organizations face a build-versus-buy decision. Custom in-house models or commercial forecasting platforms?
Building In-House
Building internally offers maximum customization and control. Data scientists can tailor every aspect of feature engineering, model architecture, and evaluation metrics to specific business needs.
The requirements? Skilled ML talent (expensive and scarce), substantial engineering resources to build data pipelines and model deployment infrastructure, and ongoing maintenance commitment.
Smaller organizations rarely justify this path. Even large enterprises increasingly question whether forecasting ML is truly a competitive differentiator worth building versus buying.
Commercial Platforms
Dedicated forecasting platforms provide pre-built ML models, automated data integration, and user-friendly interfaces. Sales teams can interact with forecasts without understanding the underlying algorithms.
The tradeoff is flexibility. Commercial solutions offer less customization than in-house builds. But for most organizations, 80% accuracy with 20% effort beats 85% accuracy requiring full data science teams.
When evaluating platforms, check the official documentation for current feature availability—capabilities evolve rapidly and specific tier details matter.
The Role of Explainability
Black-box predictions create trust problems. Why did the model forecast a 30% demand increase next month? Without explanations, stakeholders can’t validate whether predictions make business sense.
Explainability techniques help. SHAP (SHapley Additive exPlanations) values quantify each feature’s contribution to individual predictions. Feature importance rankings show which variables most influence overall model behavior.
Research on stack-based ensemble models for food demand forecasting emphasizes importance of explainability for stakeholder trust—which factors drove that specific forecast.
For sales teams, explainability bridges the gap between algorithmic predictions and business intuition. A forecast showing that the predicted uptick stems from historical seasonality plus recent campaign performance is far more actionable than a bare number.
Integrating Forecasts into Business Processes
Accurate predictions only create value when integrated into decision-making workflows.
For inventory management, ML forecasts feed directly into automated reorder systems. When predicted demand for an SKU crosses reorder threshold, the purchase order generates automatically.
For capacity planning, aggregated forecasts inform hiring decisions, production scheduling, and facility utilization plans. Revenue operations teams use forecasts to set quotas and allocate resources across territories.
The integration must be bidirectional. As actual sales data flows in, it updates the model’s training dataset. Continuous learning cycles ensure predictions stay aligned with evolving reality.
Future Directions in ML Sales Forecasting
The field continues evolving rapidly. Several emerging trends are reshaping what’s possible.
Graph neural networks for demand forecasting leverage relationships between products, customers, and locations. Instead of treating each time series independently, graph-based models learn how entities influence each other—how a spike in Product A sales might predict increased Product B demand, or how regional patterns propagate.
Attention mechanisms borrowed from natural language processing help models focus on the most relevant historical periods when making predictions. Not all past data points matter equally; attention weights let the model emphasize the most informative precedents.
Probabilistic forecasting moves beyond point predictions to full probability distributions. Instead of “we’ll sell 1,000 units,” probabilistic models output “70% chance of 800-1,200 units, 95% chance of 600-1,500 units.” This uncertainty quantification enables better risk management.
Measuring ROI of ML Forecasting Investments
Implementing machine learning forecasting requires investment—technology, talent, time. Quantifying the return justifies that spend.
Inventory cost reduction is often the largest savings category. Overstock ties up working capital and increases warehousing costs; understock loses sales and frustrates customers. Better forecasts directly reduce both.
Calculate baseline inventory costs under current forecasting methods, then project reductions from improved accuracy. If carrying costs are 20% annually and improved forecasts reduce excess inventory by $2M, that’s $400K annual savings.
Revenue protection from reduced stockouts also drives ROI. Every lost sale due to out-of-stock represents revenue you’ll never recover. If 5% of demand currently goes unfulfilled and better forecasts cut that to 2%, the revenue impact is substantial.
Operational efficiency gains compound over time. Fewer emergency orders, smoother production schedules, and better capacity utilization all flow from more accurate demand predictions.
Frequently Asked Questions
What accuracy level should I expect from ML sales forecasting?
Accuracy varies significantly based on demand pattern complexity and data quality. Authoritative studies show MAPE ranging from 6.67% for well-behaved products with differentiated Random Forest models to 41.62% for products with highly irregular demand using XGBoost. Traditional methods like ARIMA typically achieve 28-49% MAPE on the same datasets. Most organizations should expect 15-25% improvement over existing manual forecasting approaches when implementing ML properly.
How much historical data do I need to train ML forecasting models?
Generally speaking, at least 18-24 months of historical data provides sufficient training material for most ML models. More is better—36+ months allows the model to learn multiple seasonal cycles. However, data quality matters more than quantity. Clean, consistent data covering 18 months outperforms noisy, inconsistent data spanning five years. For products with weekly or daily seasonality, ensure coverage of multiple full cycles of each seasonal pattern.
Can machine learning forecast sales for brand-new products?
Direct ML forecasting for products with zero sales history faces fundamental limitations—the model has nothing to learn from. Workarounds include training on analogous products (similar category, price point, customer segment), incorporating external market research data, using product attribute-based models that predict based on features rather than history, and transitioning to pure ML approaches once several months of actual sales data accumulates.
Which performs better for sales forecasting: Random Forest or XGBoost?
Neither consistently dominates across all scenarios. Benchmark data shows Random Forest Diff achieving 6.67% MAPE on Product A versus XGBoost’s 25.06%, but XGBoost scored 19.51% on Product C compared to Random Forest’s 30.79%. The optimal choice depends on your specific demand patterns, data characteristics, and implementation details. Best practice: test both on your actual data with proper cross-validation and select based on measured performance rather than theoretical superiority.
How often should ML forecasting models be retrained?
Retraining frequency depends on how quickly market conditions change. Fast-moving consumer goods or highly seasonal products benefit from monthly or even weekly retraining. B2B products with longer sales cycles might retrain quarterly. Monitor forecast accuracy over time—when performance degrades beyond threshold (typically when MAPE increases by 15-20% from baseline), trigger retraining regardless of schedule. Automated systems can retrain continuously as new data arrives.
What’s the difference between point forecasts and probabilistic forecasts?
Point forecasts provide single predicted values: “expected sales next month are 10,000 units.” Probabilistic forecasts provide full probability distributions: “80% confidence interval is 8,500-11,500 units; 95% confidence interval is 7,200-13,000 units.” Probabilistic approaches better support decision-making under uncertainty, enabling scenario planning and risk-adjusted inventory strategies. They’re particularly valuable when the cost of overestimating differs substantially from underestimating.
Can ML forecasting work for small businesses with limited data?
Small businesses face challenges but aren’t entirely excluded. Start with simpler models that require less training data—time series methods enhanced with basic ML techniques rather than complex deep learning. Leverage external data sources to supplement limited internal history. Consider cloud-based forecasting platforms that provide pre-trained models requiring less customization. As the business grows and data accumulates, gradually transition to more sophisticated approaches. The ROI calculation matters more than business size—if inventory or capacity decisions have material financial impact, forecasting investment may justify regardless of company size.
Moving Forward with ML Forecasting
Machine learning hasn’t just incrementally improved sales forecasting. It’s fundamentally changed what’s achievable when predicting future demand.
The performance gap between traditional methods and modern ML approaches is too large to ignore. Organizations still relying on manual spreadsheet forecasts or basic trend projections are flying blind compared to competitors using data-driven predictions.
But here’s what matters: don’t let perfect be the enemy of good. You don’t need a PhD-level data science team or six-figure software investments to start improving forecasts with machine learning.
Begin with pilot projects on high-impact product categories. Measure results rigorously. Build organizational trust in ML predictions through demonstrated accuracy over time. Then scale systematically to broader applications.
The businesses that master ML forecasting gain compounding advantages: better inventory efficiency, higher service levels, more accurate capacity planning, and ultimately superior profitability. That’s not hype. That’s measurable reality backed by authoritative research showing 3-7× accuracy improvements over traditional approaches.
Start now. The competitive advantage goes to those who act, not those who wait for perfect conditions that never arrive.
 English
  German
  Arabic
  French
  Dutch
Dutch  Spanish